I’ve done this hike twice, and the two trips were like night and day. This was early July of 2020.

A vertical Sitka Columbine (I believe) from above, with droplets of water hanging from its long stem.
Looking down an evergreen-and-wildflower-covered hillside.
Taper-leaved penstemon, I believe.

I don’t know what this grass is, but I found the dark seed head striking.
Olympic Mountain fleabane, I think.
A rocky mountain rising out of the clouds.
Another photo of the cloud layer below us.
A photo of the trail disappearing around the corner, with a backdrop of mountains and clouds.
A photo from the sunny side of Mount Townsend, with sparse clouds above and a low-hanging sea of clouds covering the valleys below.
Maybe it’s some kind of Jacob’s Ladder? I’m stumped.
Valleys covered in a blanket of clouds.
Mountain ridge after mountain ridge, with snow in the distance!
A trail through the wildflowers of this mountain top.
The meadow-y mountain top of Mount Townsend overlooking the Salish Sea with Vancouver Island and the San Juans in the distance.
Close-up of a bunch of wildflowers — arrowleaf groundsel, tufted saxifrage, western wallflower. I think.
Another close-up of a bunch of wildflowers and grass — lots of purple and green, and some wonderful textures.
Another shot of the trail through wildflowers, with sun beginning to set behind a horizon of mountain tops.
The same mountain ridges and blanket of clouds from a different angle, plus some sunset colors.

I think I’ve learned a few things in pulling these photos together — mostly of the “take more better photos” variety. I finally got around to purchasing a copy of Wildflowers of the Pacific Northwest, but I just don’t have enough photos of some of these flowers to have any confidence in my flower identifying. There’s also a significant number of shots I took from parts of this hike where the views were truly wonderful, but included people. I appreciate the additional excuse to do this hike again though!

I made a trip up to Bearhead Mountain with a few friends in early July of 2019. This was a cloudy, damp day, so we didn’t get any views of Rainier, but I really go in for those trips where everything is covered in dew drops and hints of mountains appear and disappear as clouds move through, so this was an A++ hike in my book. We mostly had the trail to ourselves, too — except for an older man we saw coming down, who claimed the trail was blocked up ahead. We saw no sign of the fallen tree he was talking about, and suspected he may have just been trying to keep the crowds away. I can sympathize; this trail was wonderfully almost-over-grown, with no trash and no crowds, a wonderful respite to some of the other trails in the area.

Looking back at the photos I have from this trip, there’s a lot missing. I’ve since gotten a better camera, too, but I can’t say that my photography skills have actually improved.

A small lake we passed early on in the trail. If I recall correctly, there was a lot of skunk cabbage around the trail here, and things may have gotten a little wet.
So many flowers everywhere! So many different shades and shapes of green! So much dew!
A bear grass covered hillside with trees, mountains, and clouds in the background.
A foggy hillside covered in bear grass and other flowers and grasses, rocks, and fallen logs.
Dewy, purple-flowered plant growing amidst the rocks. Rock Penstemon, perhaps?
The wonderfully messy-haired seed head of the Western PasqueFlower — what I often call the Dr. Seuss plant. The actual flowers on these are way less interesting than what the flower becomes.
Pink mountain-heather.
A slightly-blurry photo of the trail cutting through a hillside of dewy bear grass and silky lupine.
An even foggier hillside covered in more bear grass.

I did not know what XDebug was six months ago.

I had thought, more than once, that it was quite sad that I couldn’t use something like the Javascript Chrome debugger to work through problems in the PHP code I was writing.

I had assumed that, because I’d never known a PHP developer to use a debugger, there was no such tool, or that if there was, it would be annoyingly difficult to use.

I won’t lie and say that XDebug will cut the debugging time of every issue you have in half. I won’t pretend that I use it every single day. But it is a tool that, if you really want to be a better programmer, you need in your tool belt. And it’s a tool I didn’t even know existed, because no one I knew used it.

Why You Should Use XDebug

Let me explain the claim I made: “if you really want to be a better programmer,” you need to be using XDebug.

XDebug is a (the) “Debugger and Profiler Tool for PHP“. It also supposedly “provides code coverage functionality for use with PHPUnit.” It does a number of nice extra things, like fancying up your var_dump. But all I’m talking about here is using XDebug’s debugger functionality (fingers crossed, I’ll get to talk about the profiling aspect one of these days here).

When I first set up XDebug, I wasn’t certain how useful it would be. After all, PHP developers much my senior were not using it. A quick run through of XDebug with my Laravel application left me unimpressed; though it did a better job of showing me which class had actually called my bad method, XDebug did not give me as sudden and crystal-clear an understanding of the path my code was taking through all the factories and getters as I’d been hoping for.

But XDebug will make your debugging faster, safer, and more informative. Instead of having to decide where to write your var_dumps() and dies(), and having to refresh the page each time you realized you didn’t var_dump() in quite the right place, you can just set a couple of breakpoints and step over and through the code as you need. You can decide, on the spot, which variables you want to be watching. You’re less likely to accidentally leave some of that debugging code behind — and you’re less likely to accidentally change things for the worse while trying to debug an issue.

XDebug is especially nice for debugging issues that are occurring in loops, or other pieces of code that are called multiple times in a request. You can watch all the variables you want, and keep playing over the loops until you find something that looks funky. I’ve found this to be especially useful when my code is doing some processing over multiple items, and the data on one of those items (it’s never the first one) seems to be messing something up.

Really, there are all kinds of particular cases where XDebug really shines. In general, the more levels of difficulty added to a debugging problem, the more of a life saver XDebug becomes. And the more you use it in your day-to-day life, the more comfortable you’ll be pulling it out in those really difficult situations.

But more importantly: using XDebug, even once, will make you much more aware of the life cycle of a request to your app. Using XDebug regularly can help you write better code. Instead of just writing a line of code and rerunning the script to see if you’re getting the final result you were expecting, you can easily keep an eye on exactly what those variables are doing. Is the same calculation being done over and over and over again, when maybe it should just be saved somewhere after the first calculation? Is something else also calling your getter in this request, and you didn’t realize it?

You become much more aware of these sorts of things when you’re using XDebug. You become a better programmer.

What is XDebug, and how does it work?

XDebug is a PHP Zend extension. You obtain the appropriate .so file (or .dll file, if you’re using Windows) and add it as a “zend_extension” in your PHP configuration file(s). You can configure it just like all your other PHP configurations in that file or an included configuration file, and you’ll be able to check its configuration in the output of phpinfo(). When the extension is successfully included, you’ll also see XDebug listed in the command line output of php -v.

When configured correctly, XDebug and your IDE will talk to each other on the configured port. In the setup I talk about here, your IDE starts listening on the configured port when you “turn on” debugging. It waits for XDebug to connect, which will not happen until a request is made to your PHP server. After that request has been made, spinning up XDebug, XDebug will connect to the configured port. Assuming everything is configured correctly and the two can now “talk” to each other, the IDE will then tell XDebug where our specified breakpoints are and on what exceptions to break. Those are things you select in your IDE’s debugger UX, and you can see them communicated after each successful connection in your xdebug.log file, assuming you configure XDebug with a log file.

If the breakpoint conditions specified by the IDE are met in this request, XDebug will pause the execution of the script and, at this point, the IDE and XDebug can communicate back and forth to tell you useful things about the stack trace, what the variables in scope are, and to respond to your requests to step over or into following portions of the code. As far as I’ve been able to tell, all of this communication is logged in xdebug’s log file. You can also get your IDE to give you some logging on all of this, but so far I’ve only found VSCode’s logging useful for telling whether or not the connection was made.

Setting up XDebug

These are the general steps for setting up XDebug, whatever the specifics of your environment are.

1. Obtain the appropriate XDebug extension for your PHP install
2. Configure your PHP install to use the extension
3. Configure when and how XDebug tries to connect to the “remote” debugger
4. Obtain the appropriate extension/plugin/package for your XDebug and your IDE, if necessary
5. Configure your IDE to listen at the same port you told XDebug to connect to
6. Configure your IDE to use the correct path mappings

There are some environments that make this all incredibly easy. If you’ve got a single PHP version, installed and managed by a good package manager, and on the same machine as your IDE, the package manager and IDE can take care of nearly the entire thing for you.

For example, if you’re running PHP on OSX and you’re managing that install via Homebrew, you can simply run

brew install php71-xdebug #or php56, whatever you see for you PHP version in brew list

That single line will get the appropriate XDebug extension and create a PHP configuration file that will include XDebug for you.

Or if you’re running CentOS and using Yum, you should be able to run

sudo yum install php-pecl-xdebug #this installed, among other things, php-pecl-xdebug-2.2.7-1.el7.x86_64, which it knows is compatible with my version of PHP

Following both of those one-liners, I could then see XDebug in the output of php_info(); and php -v, though you’ll generally have to restart your web server (if you’re not going to be debugging a command line script) to have XDebug available for requests that go through your web server.

If we stick with the simple OSX example, you can just add three lines to the configuration file. Mine is located at /usr/local/etc/php/7.1/conf.d/ext-xdebug.ini and you can see how little is in it below. You don’t really have to add the remote_log line, but I certainly wouldn’t start off without it.

[xdebug]
zend_extension="/usr/local/opt/php71-xdebug/xdebug.so" # this line was already there
xdebug.remote_enable = 1
xdebug.remote_autostart = 1
xdebug.remote_log = "/[path_where_I_log_things]/xdebug.log"

I didn’t even have to add a line specifying my port or host; the defaults are 9000 and localhost, respectively.

Then I went to my IDE, which happens to be Visual Studio Code, and installed the PHP XDebug extension by Felix Becker. The extension is available on Windows and OSX, and came up as the top thing for me when I searched XDebug in the extension marketplace. VSCode creates a new launch.json file for each project you debug in; when you first go to turn on debugging it’ll ask you what kind of debugging you want to do. You select “PHP,” and the config file that it’ll autogenerate will look something like this:

{
// Use IntelliSense to learn about possible attributes.
// Hover to view descriptions of existing attributes.
// For more information, visit: https://go.microsoft.com/fwlink/?linkid=830387
"version": "0.2.0",
"configurations": [

{
"name": "Listen for XDebug",
"type": "php",
"request": "launch",
"port": 9000
},
{
"name": "Launch currently open script",
"type": "php",
"request": "launch",
"program": "${file}",
"cwd": "${fileDirname}",
"port": 9000
}]}

You have to choose which configuration option you want to use (I never use “launch currently open script” as I’m generally debugging whole applications, rather than individual script files), but both of them work immediately. That’s it!

Your particular IDE will have its own quirks about the debugging process, but VSCode’s was similar enough to Chrome’s that I didn’t have to look anything up. Nonetheless, they seem to have useful instructions on using breakpoints, etc, over here. I know plenty of other IDEs have similar instructions.

For all the other scenarios

Of course, it’s not going to be that easy for a lot of people.

I now know many of my coworkers were not using XDebug because they had been unable to set it up. Setting up XDebug can provide some difficulty, and I think a large part of that difficulty actually stems from all the quick-and-dirty tutorials on getting up and running with XDebug out there. We developers work in many different environments, and XDebug needs to be configured to match those environments. Some environments certainly make things more difficult.

So at some point here I’m going to start sharing some of the tips and tricks I’ve been using for debugging other’s debug setups. Unfortunately, compiling them all into one blog post doesn’t seem like it’s going to be easily done; there are, quite simply, too many things to bring together all at once. Therefore I’ll be including links to XDebug-related posts below as they come along.

If you have any questions, feel free to email me.

Happy Debugging!

A couple of months back, I started playing with Laravel. So far, it’s been fun; at the very least, it’s nice using something more modern and popular than Yii 1. However, Laravel’s also more modern in their asset management system, and I still possess curmudgeonly feelings about this whole JS-ifying of all of our tools. I had to figure out how to use Gulp. Gulp

In previous projects, I used Compass to handle my Sass. I’d also go grab the Sass-globbing plugin, which had incredibly simple instructions for inclusion in Compass. My attempts to do similar with Sass and Elixir… hit some road blocks.

A note about globbing: I do not understand why anybody is okay with explicitly including every single Sass partial. It’s an extra step, and extra cleanup, and does not encourage breaking ones Sass out into clean components. Globbing allows you to include entire directories of partials rather than explicitly including individual files. That means no adding to the long list of partials in your main file when you create a component, and no cursing when your Sass fails to compile because you removed the partial of a component you no longer want. This is today. We have the technology.

Anyway, while I was trying to figure out how to get Sass globbing happening without Compass, I found out Laravel supports a preprocessor I’d never heard about: Stylus.

Stylus comes with globbing by default.

So I got Laravel hooked up with Stylus and, so far, I’ve really been enjoying it. There’s minimal syntax junk, and a few interesting extra features. To me, it doesn’t just feel like CSS+, but like an elegant programming language of its own. Just check out how gorgeous their “transparent” mixins are. And variable declaration uses an equal sign instead of looking like you’re defining a property, a distinction I personally appreciate:

Stylus Variables in Action

I’ve since learned that there does seem to be a package for using Sass globbing with Grunt. I haven’t tried getting it set up, because right now, I’m not ready to go back to Sass.

It was 3:23PM.

I was reading a tutorial about something unrelated when I was told that setting up a free SSL cert and HTTPS with NGINX is easy. That there’s something nifty now called Lets Encrypt, and that they just give out free certs like candy, and make it easy to config too.

I remember being told that that was a daunting task years ago. I don’t know all that much about HTTPS, but I’ve been on a little bit of an encryption kick lately. There was no way I was going to pass up the chance to add a little extra security to the internet!

So I go to letsencrypt.org/getting-started/

I’m told I should use certbot, since I have shell access to my server.

At certbot.eff.org/ I tell a cute robot-key-creature what web server and operating system I’m using — NGINX and CentOS7. The cute robot tells me to add a repository I already added years ago to my yum repo list, so I skip that step and simply run sudo yum install certbot-nginx. It works.

The site tells me I can go all-in via sudo certbot --nginx, in which case the package will go ahead and edit my NGINX conf files itself, or I can just use the certbot to get the cert and set up the confs myself. I went all in.

I was given a few basic prompts — I was asked for my email and had to agree to ToS — and then it got cool. It asked me which hosts I wanted to set up. I didn’t have to do anything and there was a list of what I believe are all the domains pointing to my IP, including with “subdomain” specificity. I chose to only set up www.willowsells.com and willowsells.com…

And then it failed validation.

The error message:

Failed authorization procedure. www.willowsells.com (tls-sni-01): urn:acme:error:connection :: The server could not connect to the client to verify the domain :: Error getting validation data, willowsells.com (tls-sni-01): urn:acme:error:connection :: The server could not connect to the client to verify the domain :: Error getting validation data

My firewall wouldn’t let the certbot reach out and do what it needed to do. Being impatient, I temporarily turned off my firewall rather than configuring it to allow HTTPS and then I re-ran the certbot. I got another prompt asking me whether or not I wanted to force the site(s) to direct to HTTPS and that was that. There was my site, running HTTPS, and doing a 301 redirect for the HTTP URLS!

I did have to enable HTTPS on my firewall and restart it. Running sudo firewall-cmd --permanent --add-service=https and sudo service firewalld restart did it!

My site was running HTTPS and only HTTPS by 4pm. It was glorious.


Which isn’t to say there weren’t other problems. My site wasn’t actually running properly.

Yes, certbot inserted the rather simple nginx confs in the right spot to get my site to serve HTTPS and redirect HTTP. This is surprising, really, as I have a rather odd nginx setup; I use nginx both as my server and my cache server, with one server block listening on port 80 and cacheing things and an upstream server block listening on 127.0.0.01 and serving files or whatever PHP gives it. Based on the console output from certbot, it did experience some confusion with my conf files, but it nonetheless accurately put this in the right server block (the top-level one):

listen 443 ssl; # managed by Certbot
ssl_certificate /etc/letsencrypt/live/willowsells.com/fullchain.pem; # managed by Certbot
ssl_certificate_key /etc/letsencrypt/live/willowsells.com/privkey.pem; # managed by Certbot
include /etc/letsencrypt/options-ssl-nginx.conf; # managed by Certbot

if ($scheme != "https") {
return 301 https://$host$request_uri;
} # managed by Certbot

# Redirect non-https traffic to https
# if ($scheme != "https") {
# return 301 https://$host$request_uri;
# } # managed by Certbot

But when that first server block handed off the request to the second server block, it didn’t hand off the information explaining that the original request was HTTPS, and the PHP generating my site at the end certainly had no knowledge of whether or not the site was HTTPS. As I understand it, this is a potential problem with HTTPS and proxies for frameworks other than WordPress, but it is definitely a problem for WordPress.

Completely expectedly, I had to go through the usual process of changing WP over to using the new URL with the https in it instead of HTTP, but that’s just a given part of the process of working with WordPress. Once I did that, the site was mostly working — except for the dashboard. If you try hitting the HTTPS version of the admin section of a WordPress site, WordPress wants $_SERVER[‘HTTPS’] to be set. It has to be set, I believe, to either 1 or ‘ON’. Otherwise you’ll get an endless redirect loop.

There are a number of unpleasant ways to get around this, and I’m not certain this is the one I’m going to go with in the long-term. Maybe I’ll just finally give in and stop using WP. But in the meantime, I simply added this in with the other stuff in my nginx config directing extra variables to be handed off to fast_cgi by NGINX: fastcgi_param HTTPS ON; and voila, no more redirects!


Thankfully, in writing this, I went back to look at the certbot website, and realized there’s an additional step I have to do, some time in the next 90 days. Apparently LetsEncrypt certs expire every 90 days, and while it’s at least as straightforward to renew them, one still has to do so. The certbot recommends setting up a process that tries to renew them twice a day every day. Better safe than sorry and all that.

Hopefully I’ll remember to do that tomorrow.

When someone posts on Facebook that they’re throwing out a 3D printer, you convince them to give it to you, period. You don’t ask silly questions like why they’re throwing out the printer, or what model it is, or whether or not it even turns on. After all, even in the worst case scenario, there are going to at least be parts to scavenge!

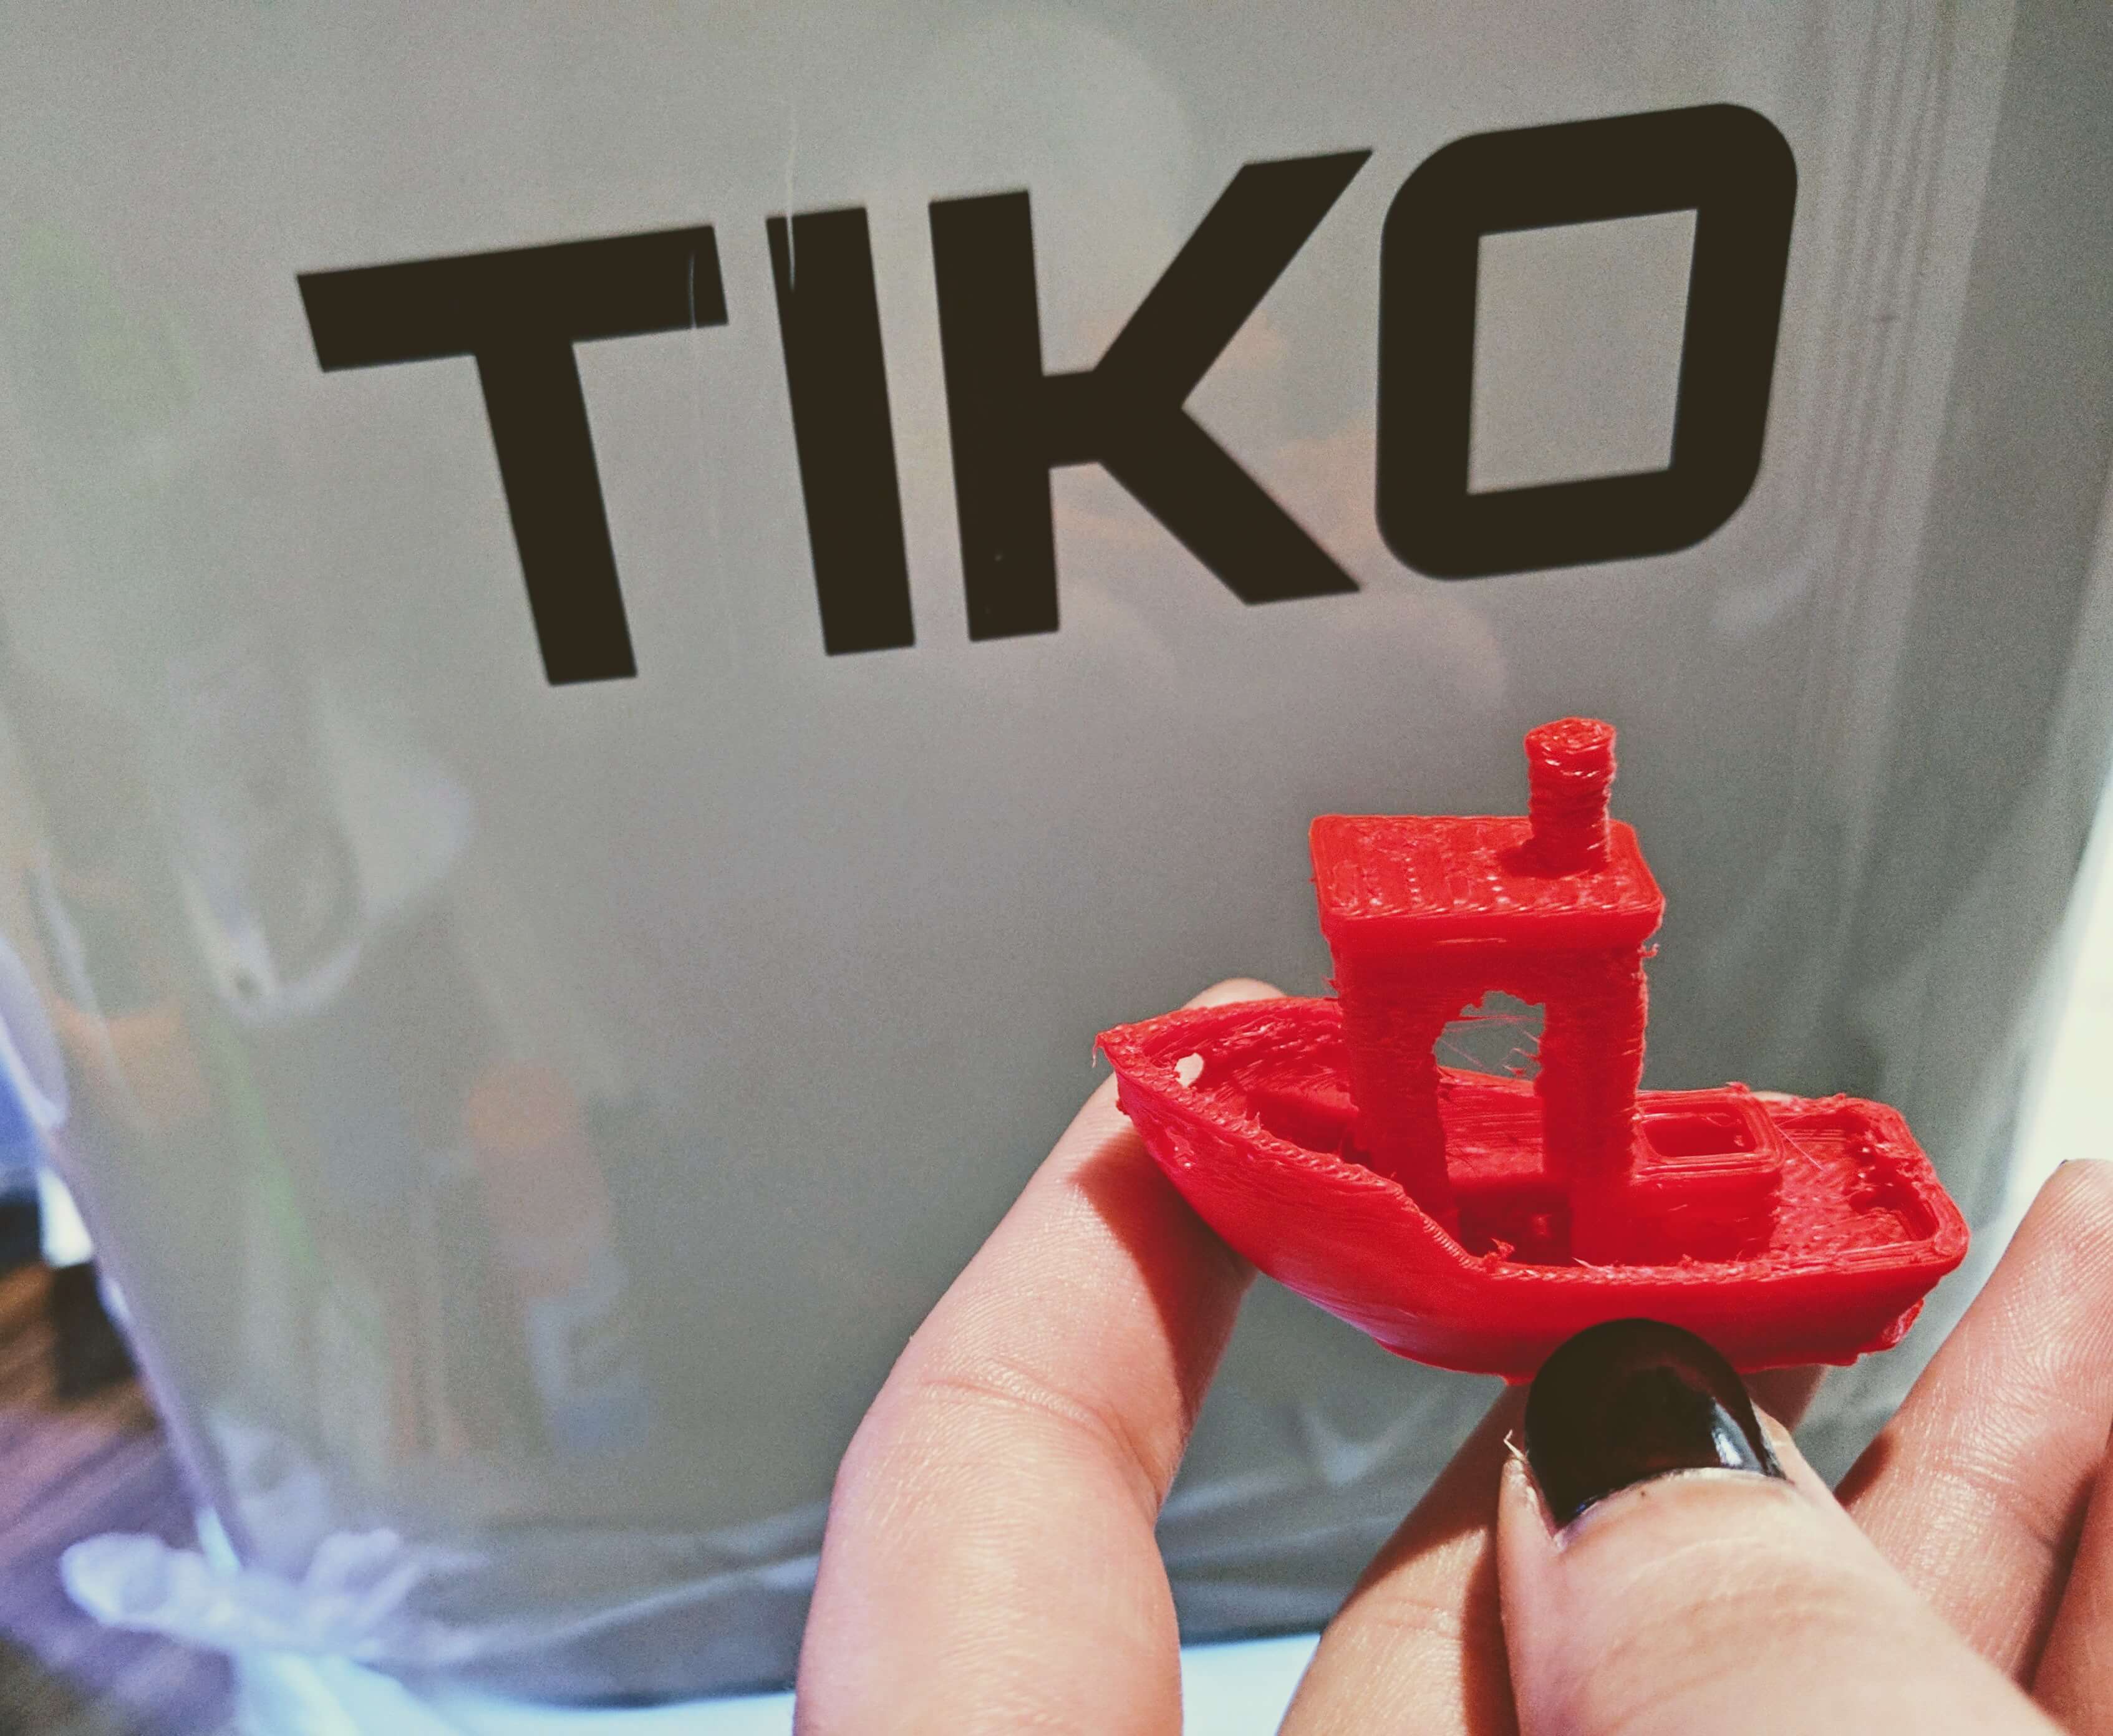
This was how I ended up with a Tiko as my first (and currently only) 3D printer.

If you’ve never heard of the Tiko, it was a Kickstarter project that failed. Miserably. So miserably that it’s exceptionally difficult to get useful advice on the printer; people just want to talk about how awful the Tiko is.

The printer does, in fact, work. It turns on. It broadcasts a wifi network. Its web interface “works,” though just opening the page turns the console very red. At some point I had to manually set a variable in the console in order to get it to connect to my wireless network, and there were further problems that cropped up when it tried to update the firmware.

It prints things. My first print was, in fact, better than many other first prints people got on the Tiko, it seems. It at least stuck to the bed all on its own.

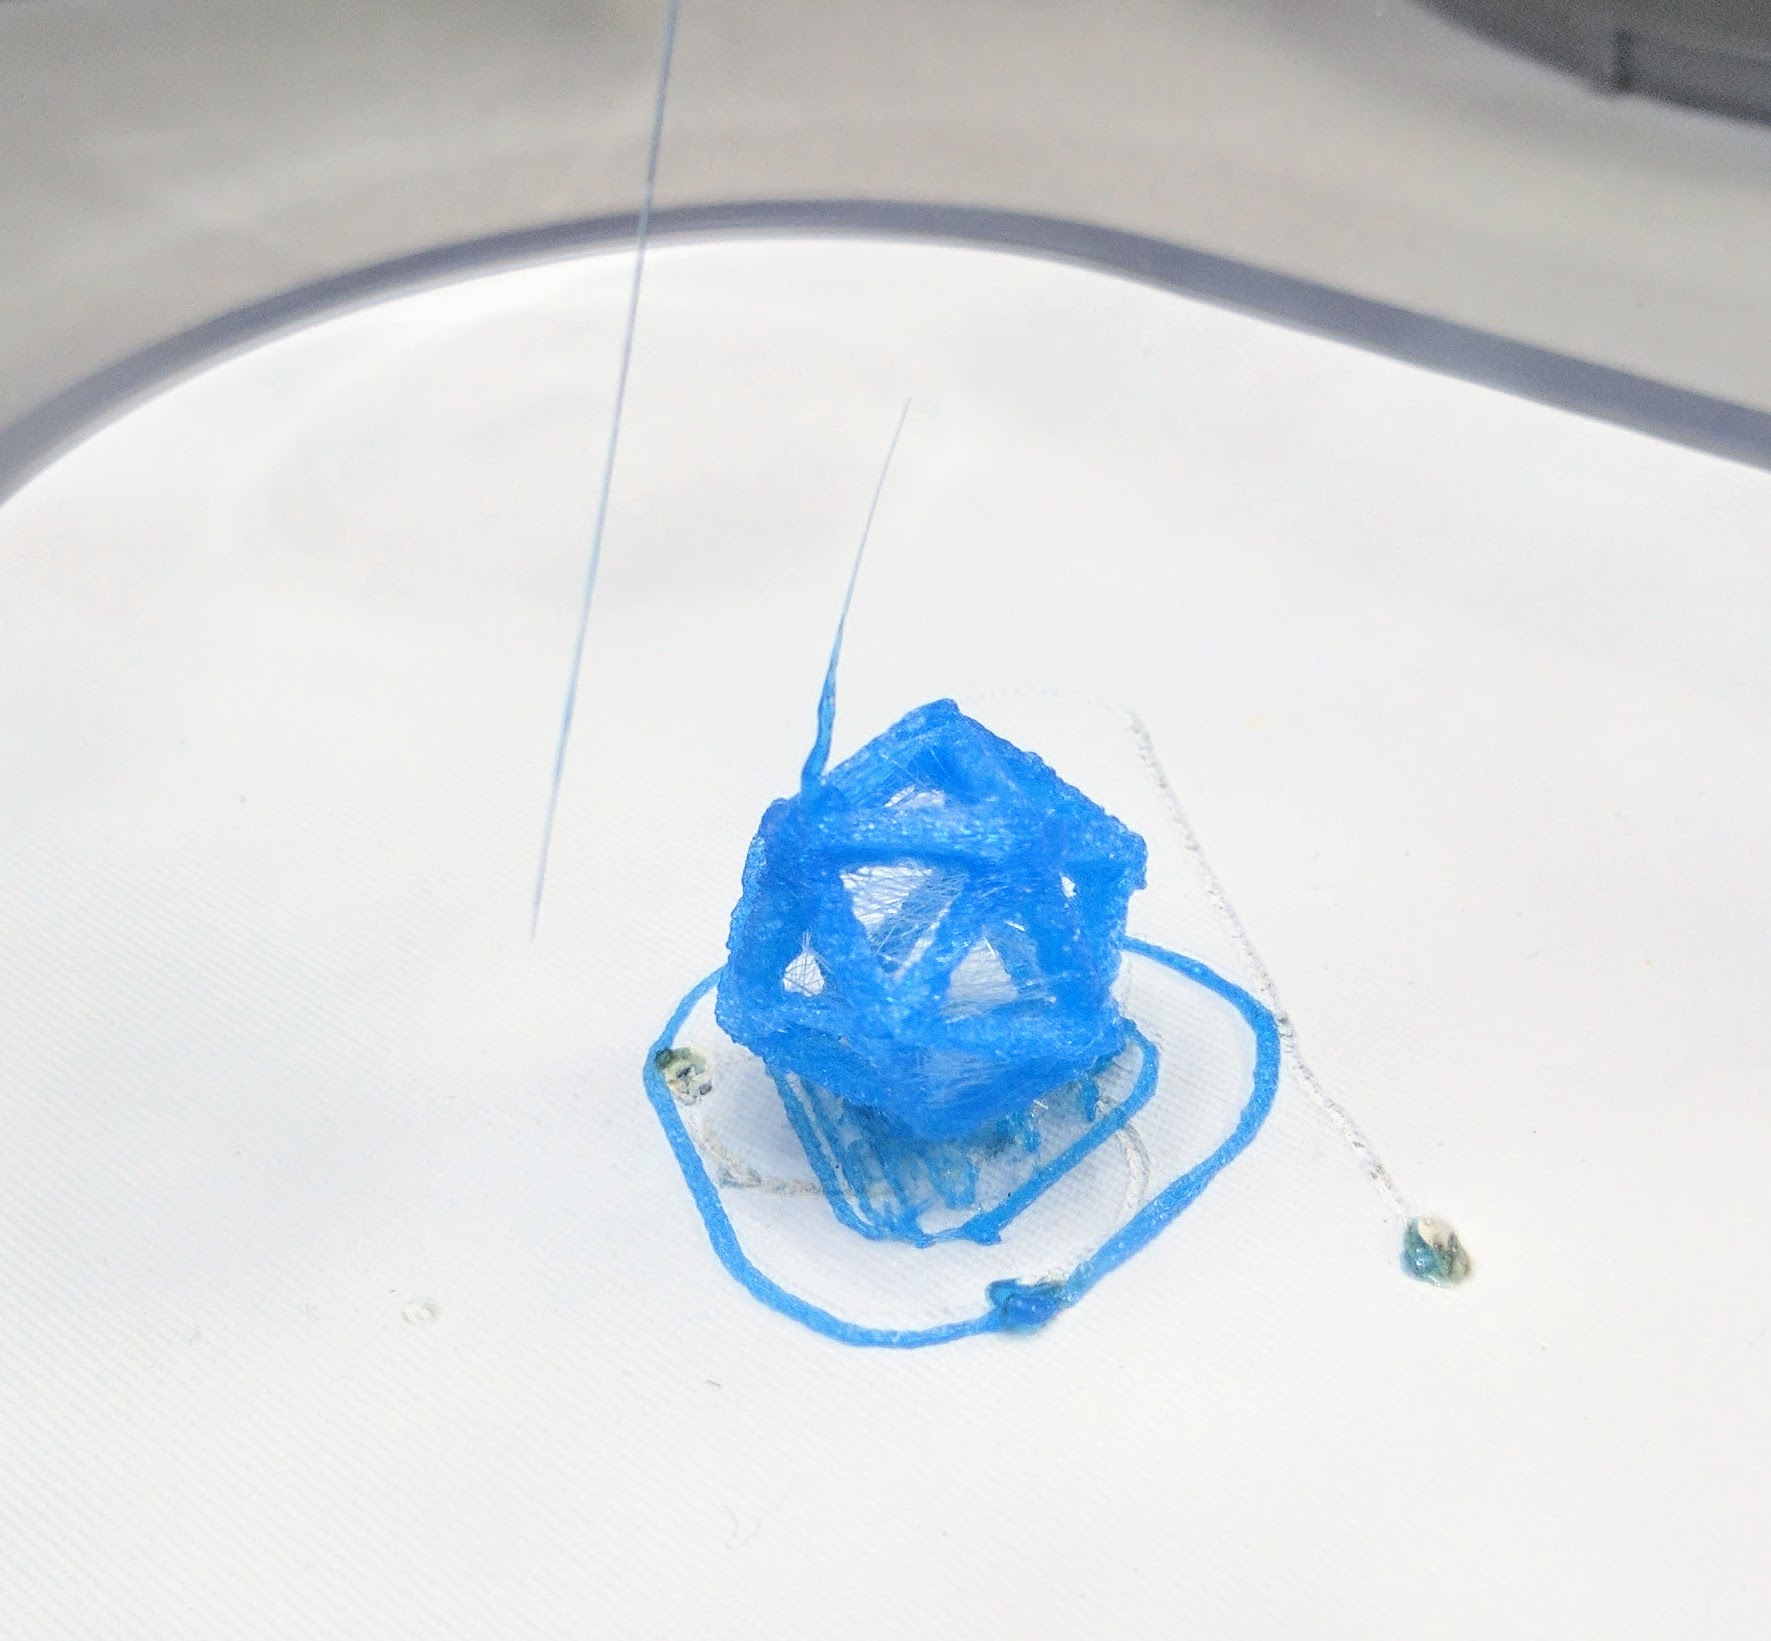
tiko-first-print-of-included-model

See all that damage to the print bed? I received the printer that way, but as I understand it, that’s a common problem people have been having using the “auto-calibration” option with the Tiko.

The thing is, auto-calibration is more important for this printer than others. Tiko took being “The Unibody 3D Printer” too far. Sure, it’s cute (though I think the most aesthetically pleasing features have nothing to do with it being unibody). But it’s pretty standard to manually calibrate a 3D printer using a piece of paper between the nozzle and the bed… which you can’t really do with this printer. When assembled, you have no access to the print bed.

So… we fixed it.
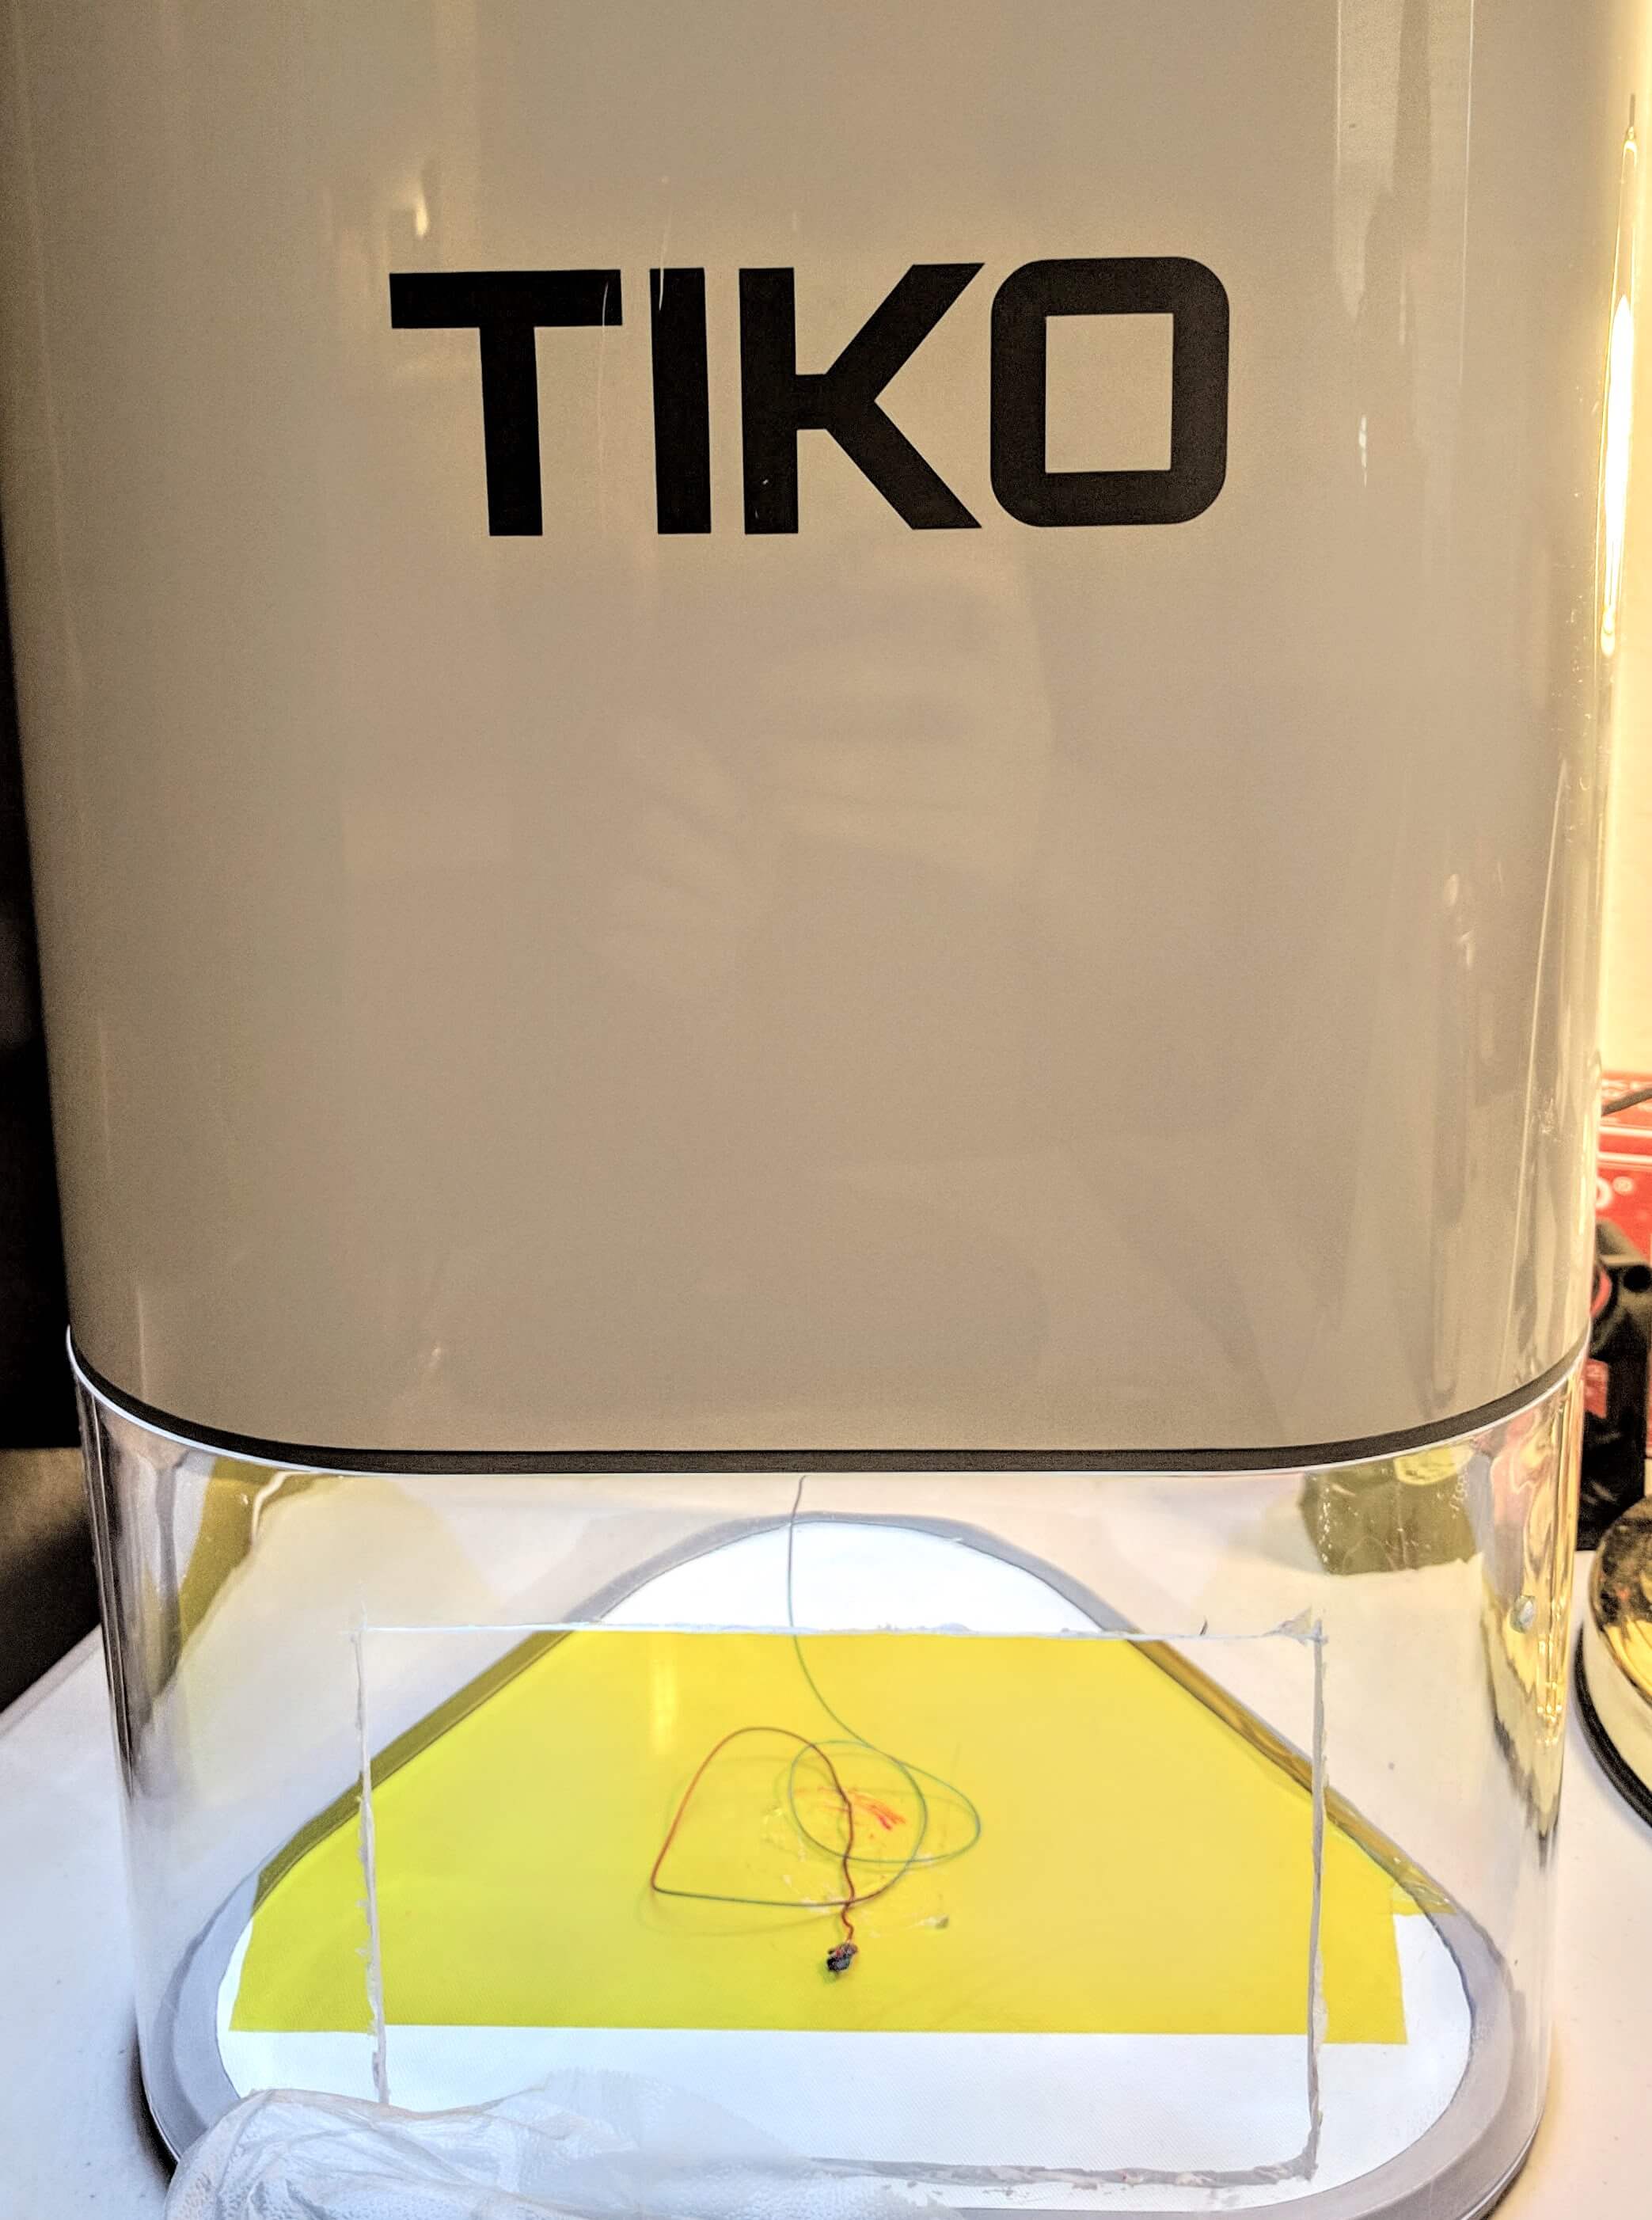
tiko-modified-body

I also heard (and saw gorgeous photos of!) great reports coming from some people who had started using the Cura slicer instead of Tiko’s built-in nonsense. I wish I could say that fixing the calibration issue and giving it better GCode allowed me to suddenly be able to make great prints. But this has not been the case.

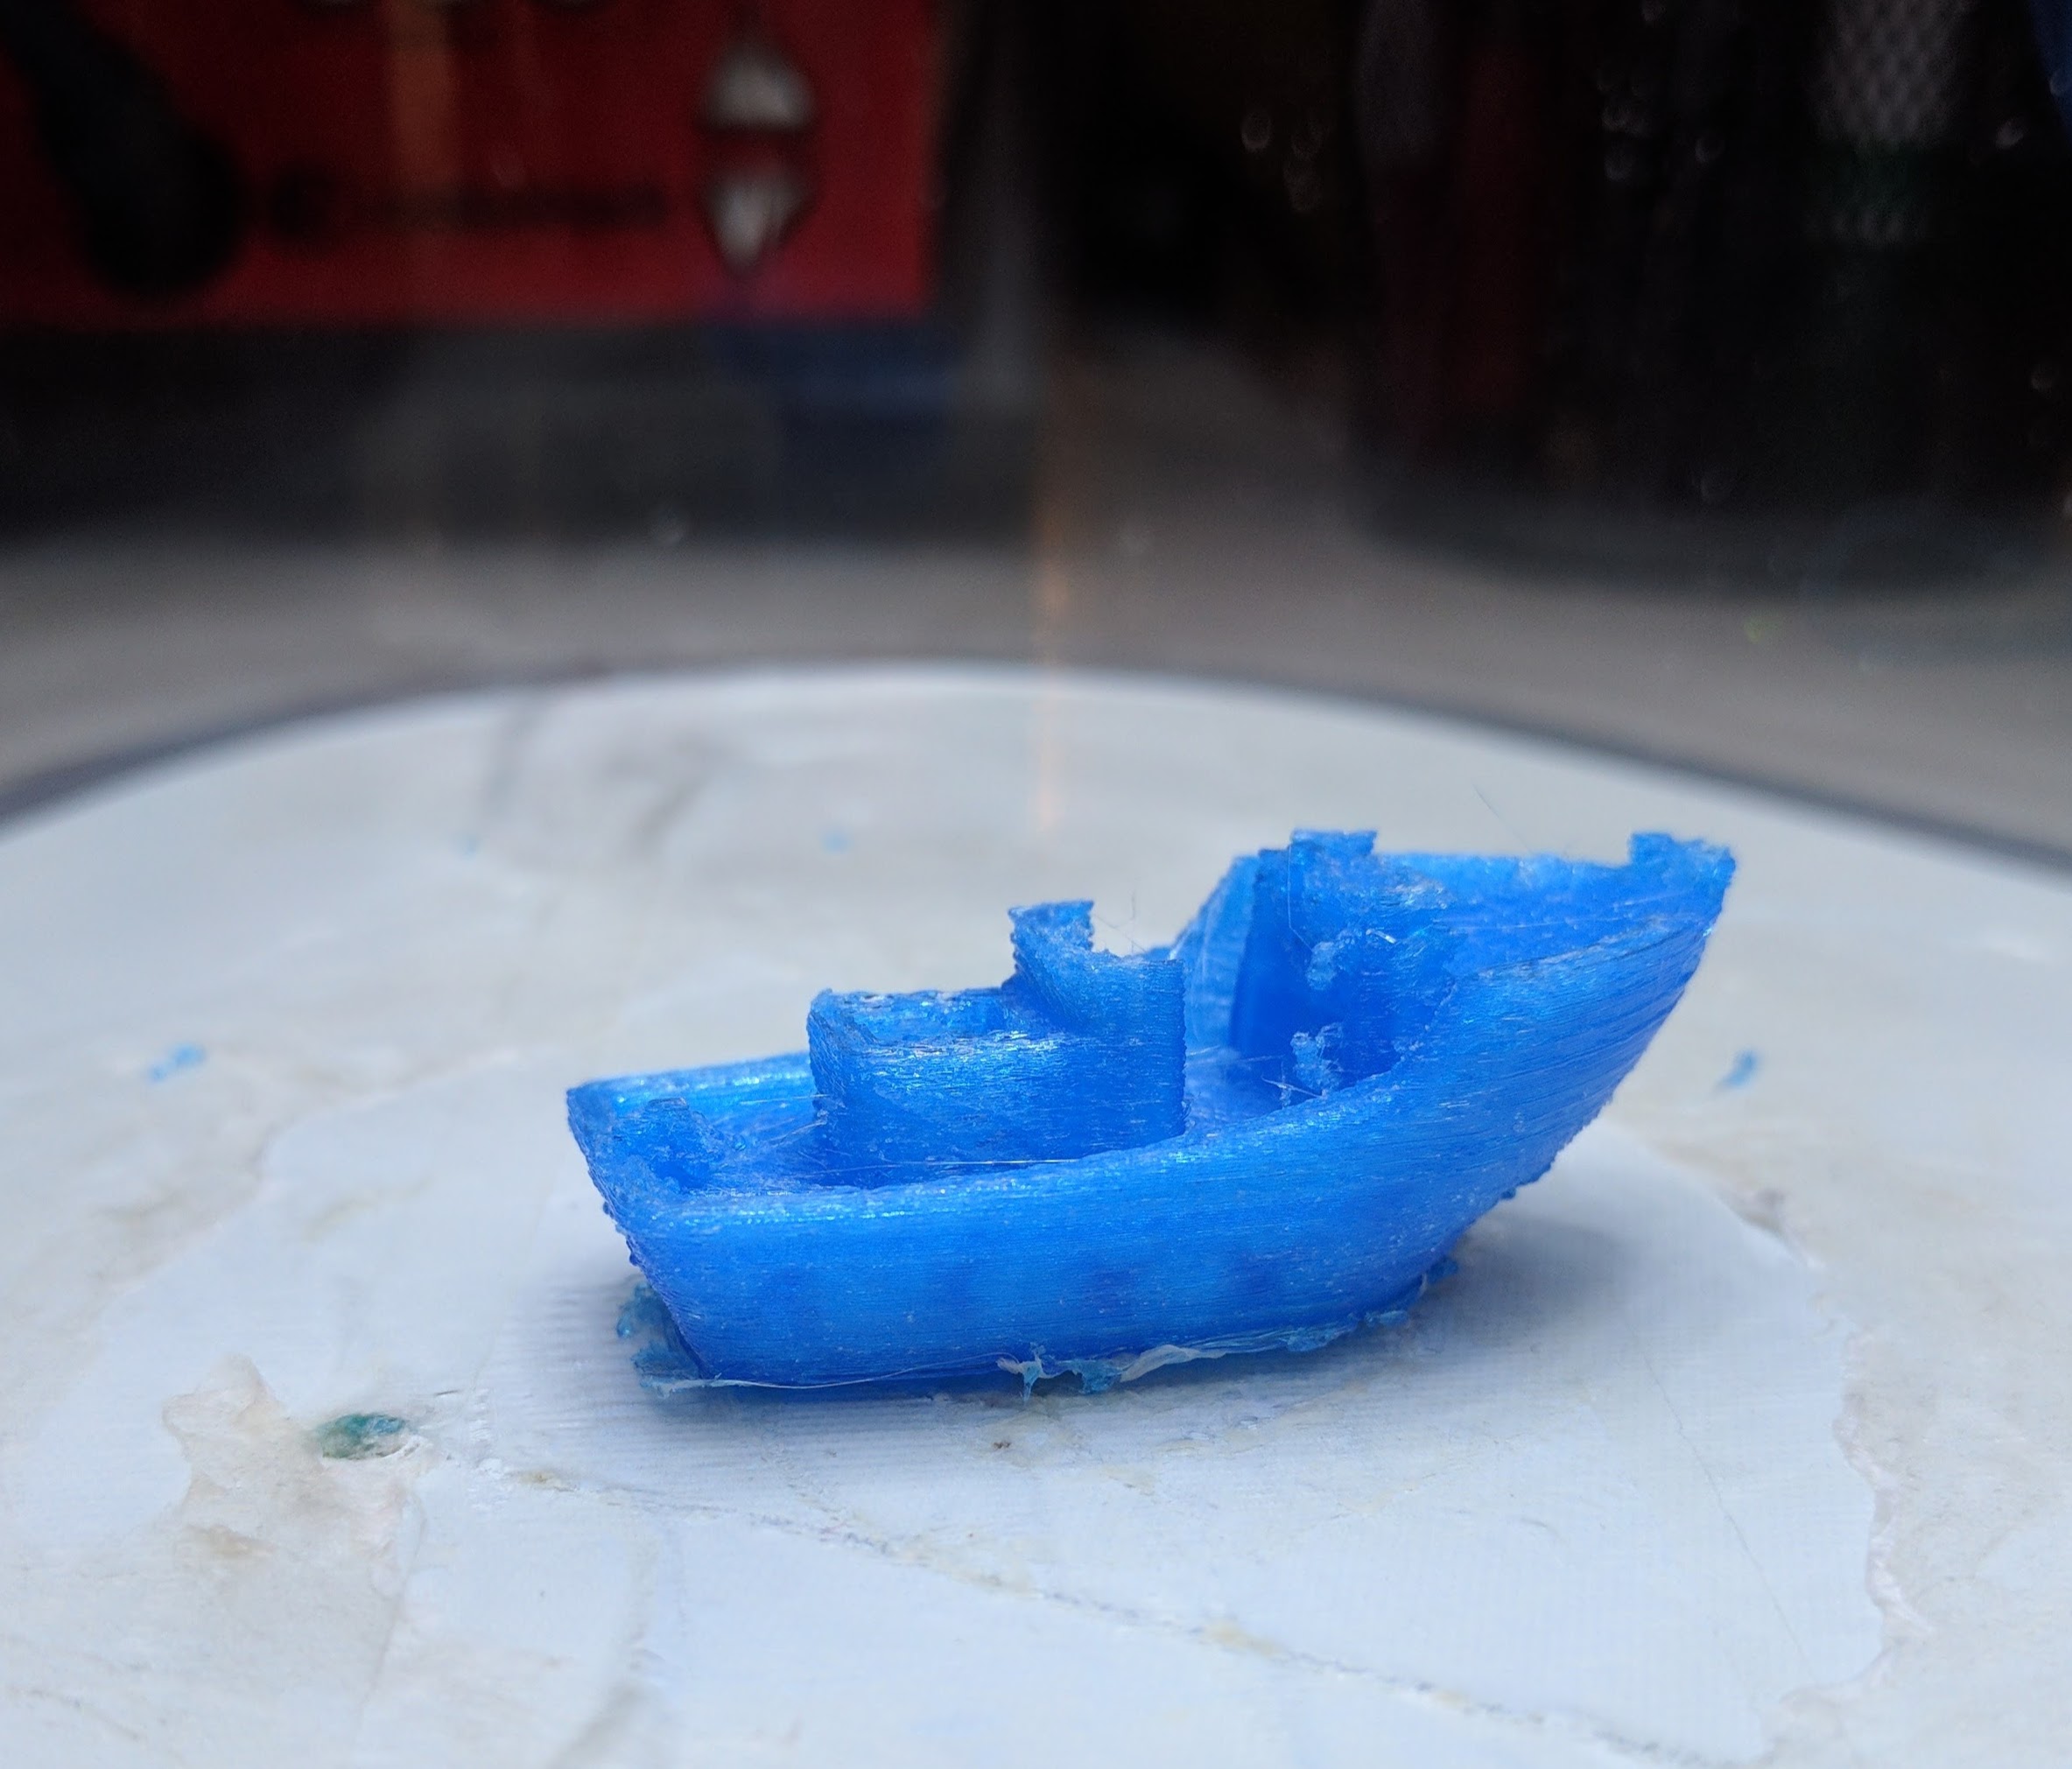
The Tiko seems to occasionally throw fits half-way up the Benchy model I’ve been using. I know other Tiko users have had similar problems as my blue half-benchy below.
tiko-failed-half-benchy

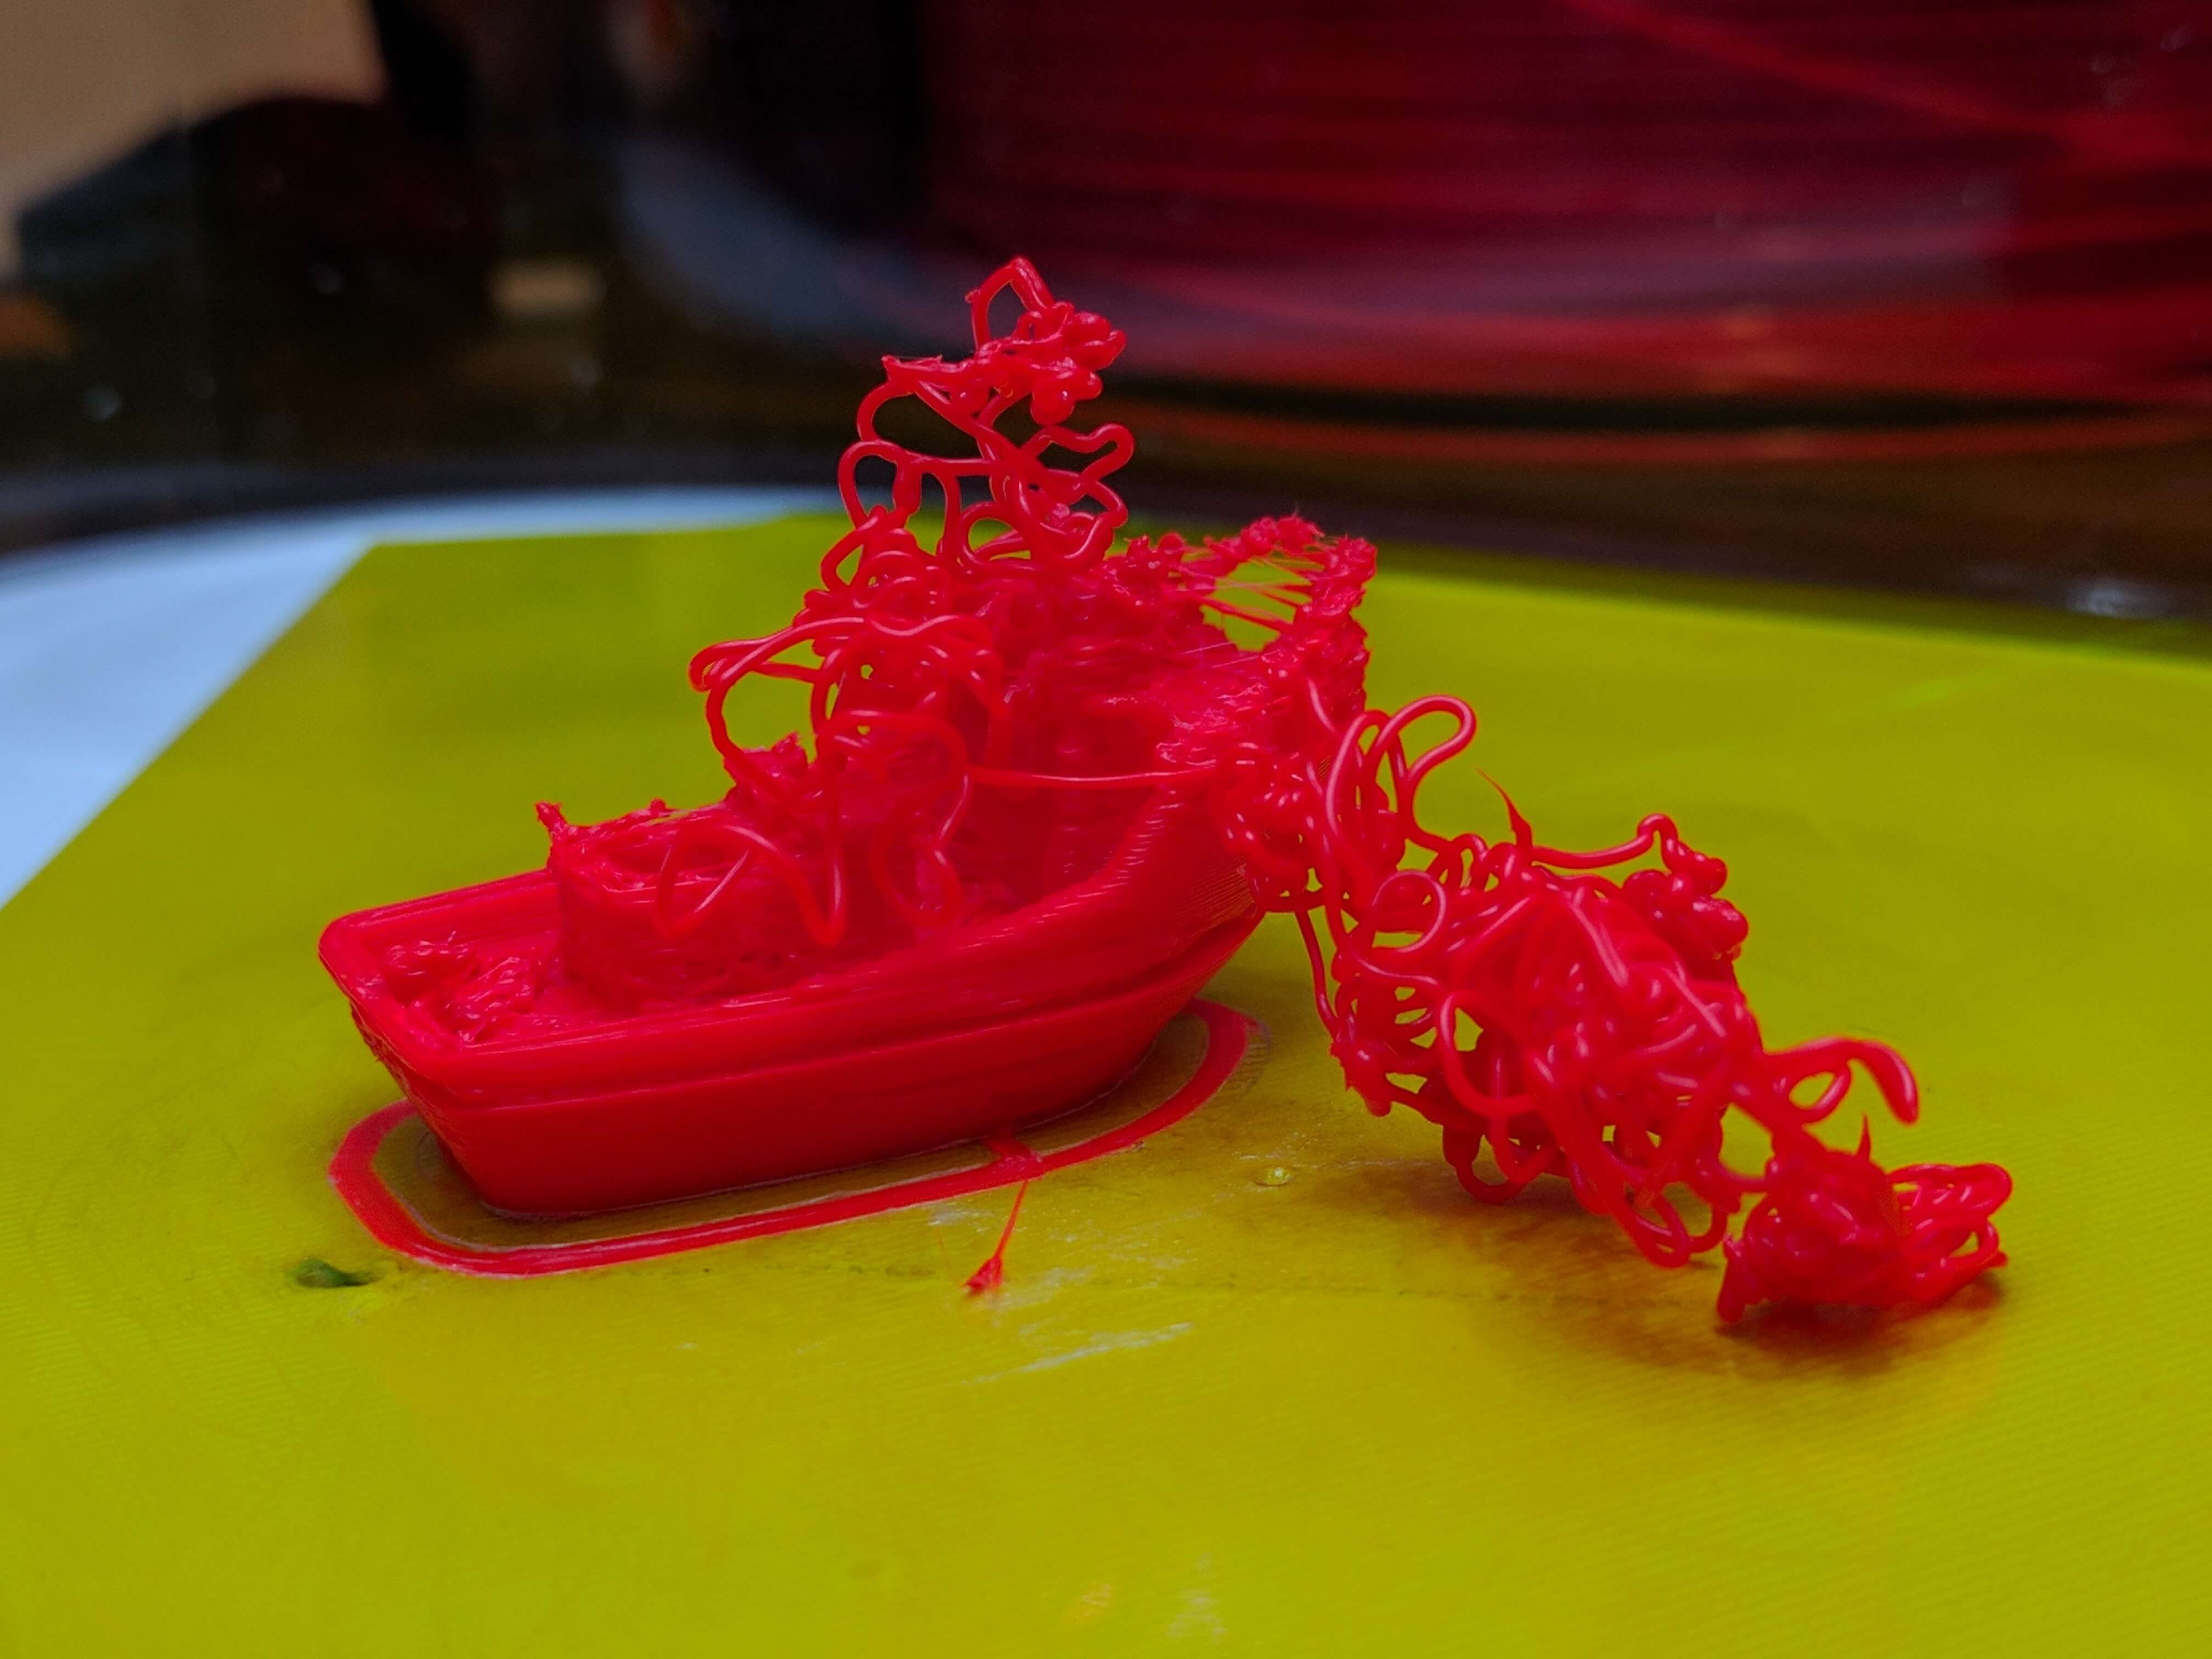
Frustratingly, this has never happened while I was watching it. The conclusion I’ve reached is that clearly my Tiko just doesn’t like it when I’m gone for too long. It did the below with some ABS when I stepped away for a quick shower.
tiko-failed-abs-benchy-spaghetti

Yes, I did just say ABS. I know the Tiko generally isn’t considered ABS-friendly; after all, the print bed isn’t heated, something often considered required for printing with ABS. Hower, the best print I got pre-Cura was with ABS. Below is the third thing I tried to print on my Tiko, before the modification to its body and before switching to using Cura.
first-abs-tiko-print

That may or may not have been my best print, period. I then tried to do the same thing with the Tiko’s Gem PLA, with a slight temperature decrease, and got this nonsense.
same-tiko-print-with-pla

I eventually managed to get this guy with the Cura slicer and some ABS on a very stickified bed (absolutely necessary with this bed).
Tiko-with-First Semi-Successful-Benchy-ABS

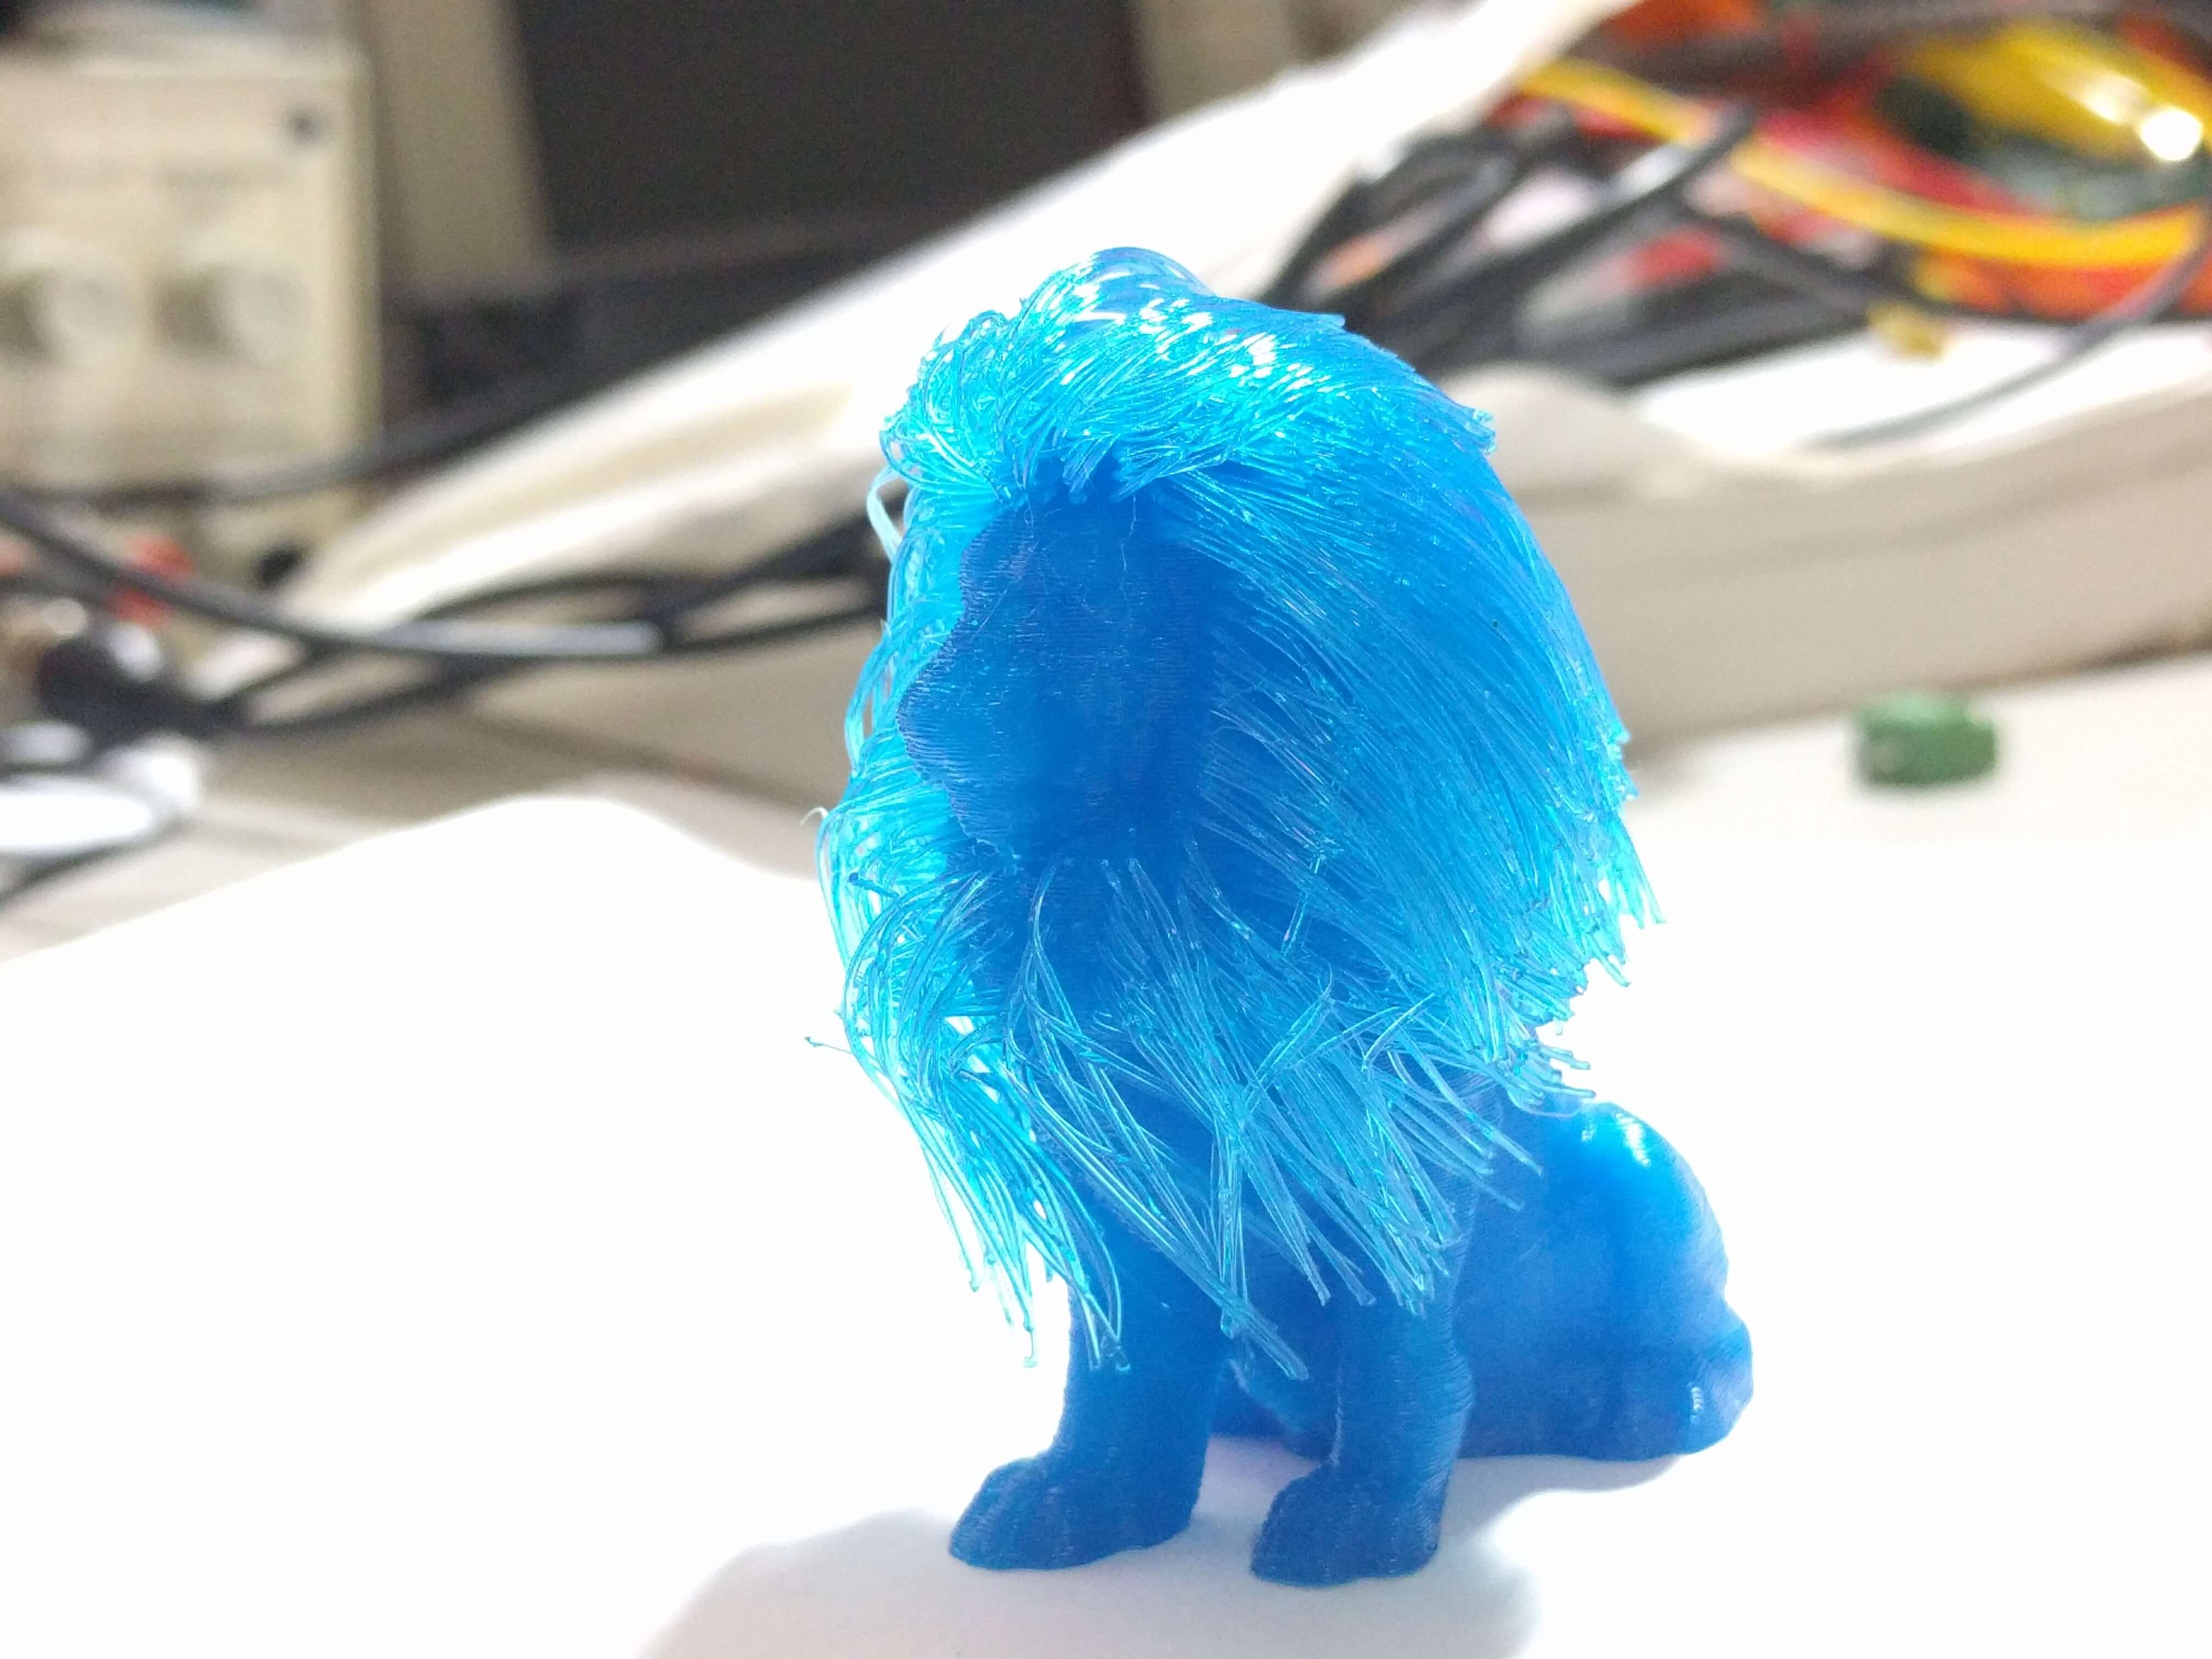
Really, if it wasn’t for the results with ABS, I probably would have given up on the Tiko all together. Which would have been quite sad, considering how much fun I’ve had learning slicer settings! After trying some ABS out in the Tiko, I was quite convinced that the PLA was simply bad (which I’m still not certain it isn’t, to some extent)… but then my friend used it in a MakerBot to create the handsome print below.
Gem-PLA-lion-mane-print

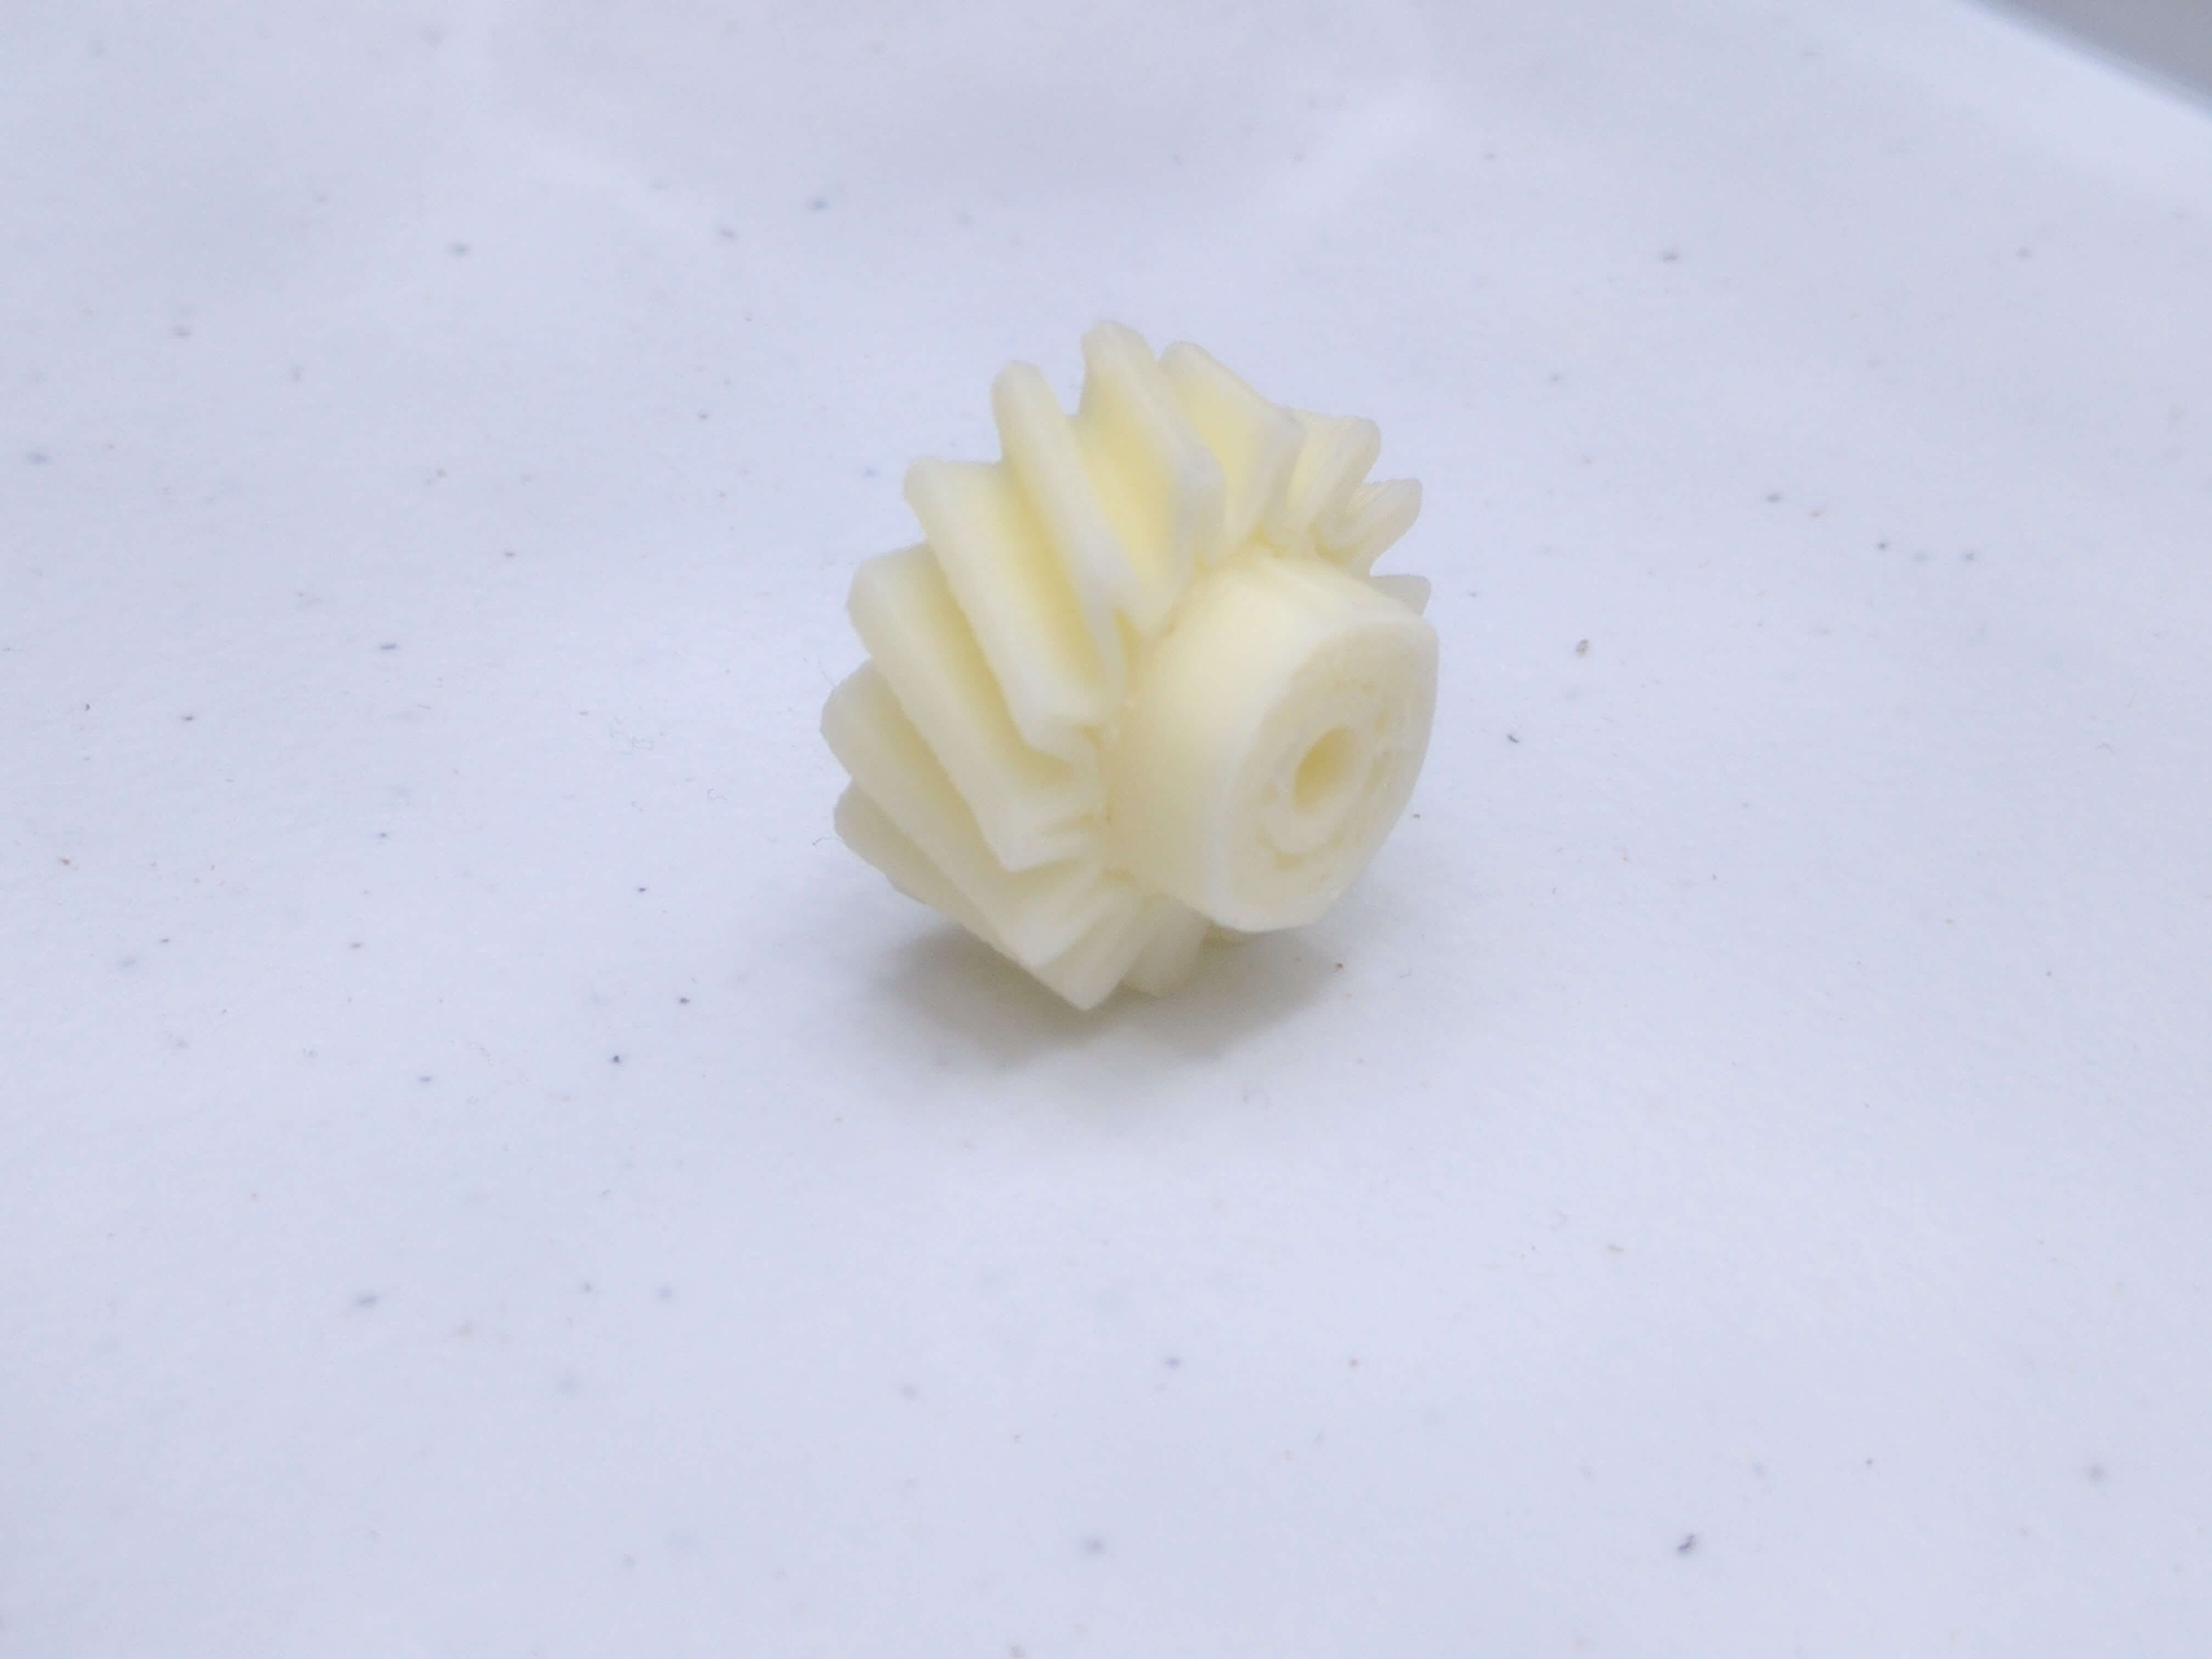
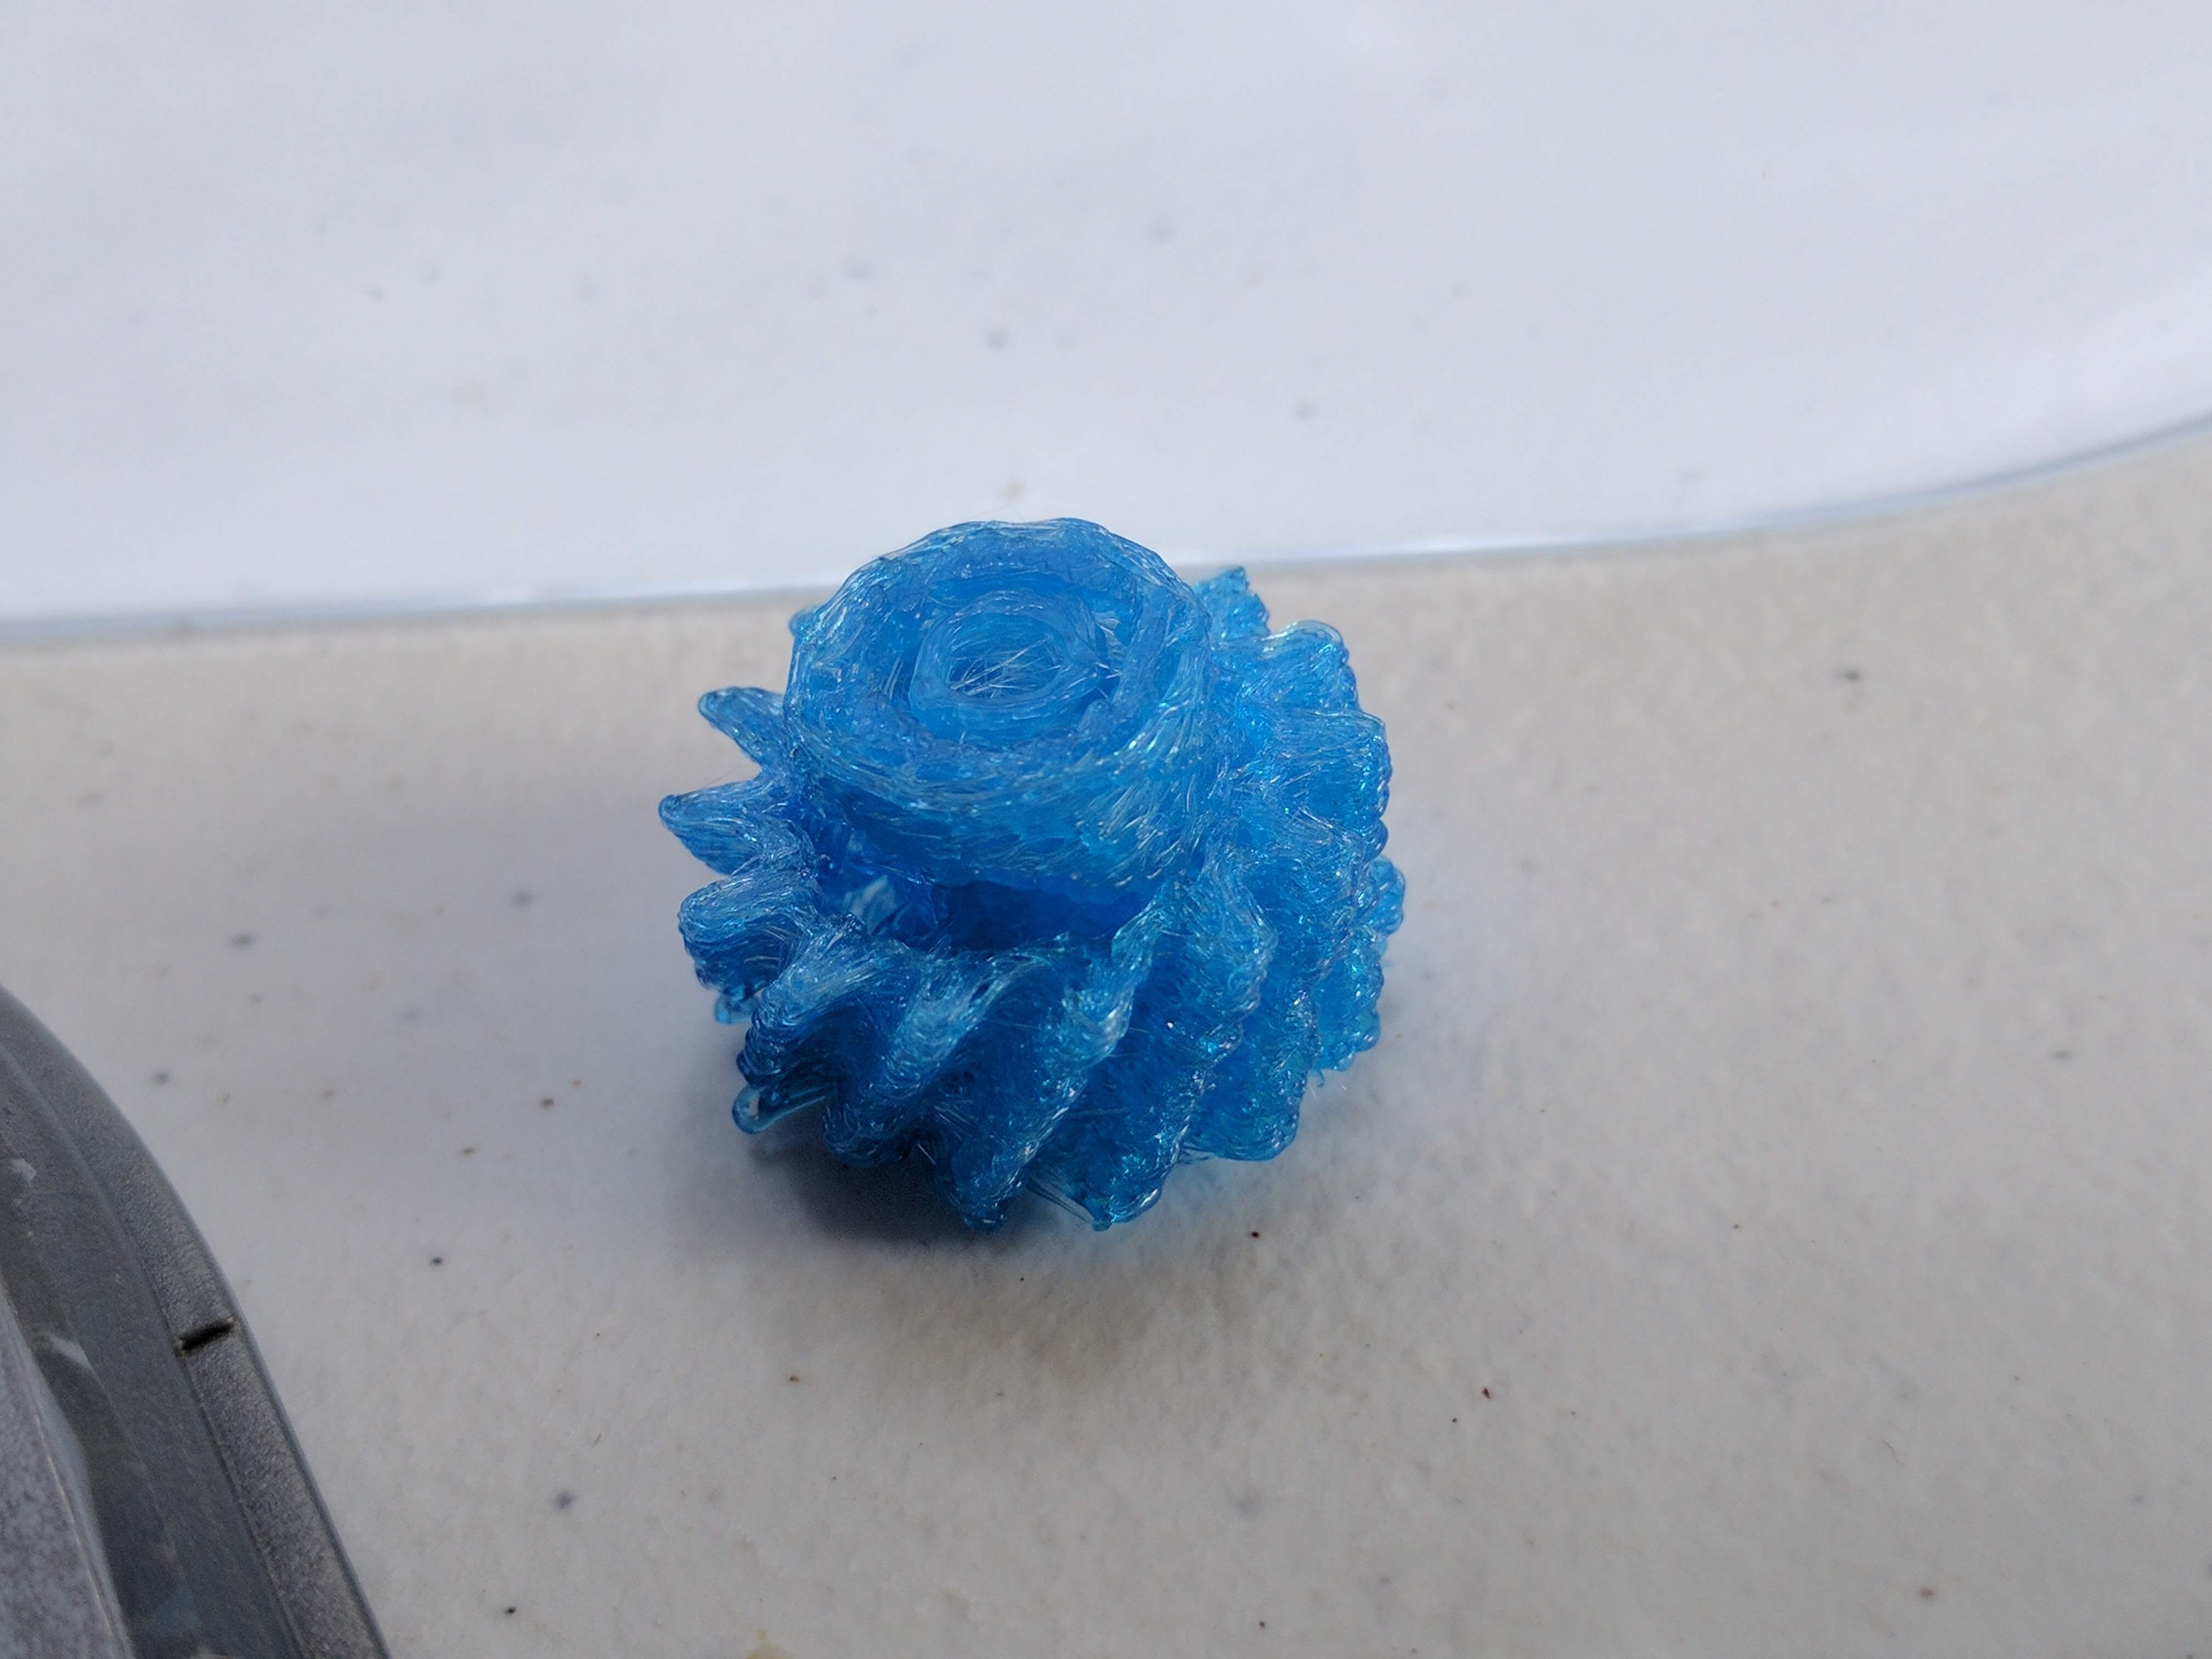
My suspicion, especially after more prints and having opened up the extruder on this thing, is that the extruder can’t really handle the thinner Gem PLA. The teeth slipping on the filament could easily explain what seems like unevenness in the PLA extrusion — something my extensive playing around with temperature settings has not yet fixed. Sadly, there does not seem to be an “easy” way to get the single bearing to push the filament any closer to the only gear’s teeth, to compensate for deviation in filament diameter. I did recently widen the last segment of the filament path in the extruder, as I noticed the tight-looping Gem PLA would occasionally get caught on an edge and it made feeding in filament occasionally very annoying.

Thankfully, not all of my Tiko problems seem to emanate from the extruder! I’ve realized that the print bed for the Tiko is awful. I can excuse it not being heated, and I know having to use tapes and glues and the like is perfectly normal with 3D printing. But all of that aside, the bed is quite simply uneven. So post #2 on my Tiko experience will hopefully include updates on attempts with a custom glass print bed! Worst case scenario, I should at least be able to print some useable gears with the Tiko, some ABS, and a heated glass print bed — more than I could really have hoped for from a free, second-hand, bankrupt 3D printer!